Road Accidents In France - Part 2: Training & Predicting Injury Severity
Investigating the prediction of road-accident injury severity in France using nationwide open data from 2019–2024. The target is a four-class severity label (uninjured, slightly injured, hospitalized, fatality), with a strong class imbalance that makes rare severe outcomes difficult to model

Series Parts
Abstract
This post investigates the prediction of road-accident injury severity in France using nationwide open data from 2019–2024. The target is a four-class severity label (uninjured, slightly injured, hospitalized, fatality), with a strong class imbalance that makes rare severe outcomes difficult to model. A comprehensive pipeline was built to clean and aggregate the multi-table data, engineer temporal and road-related features, encode high-cardinality categorical variables, and handle outliers and missingness. The modeling problem is formulated as a supervised multi-class classification task, evaluated primarily with macro-averaged F1 and class-wise recall for hospitalized and fatal cases, rather than overall accuracy.
Several model families were explored, including RandomForest (RF) baselines with over/under-sampling, and gradient boosting methods (GradientBoosting, XGBoost, LightGBM) with class and sample weighting. The best balanced model is a RandomForest with combined random over- and under-sampling, achieving good accuracy and F1 for the three non-fatal classes but limited recall for fatalities. Boosted models can substantially increase fatality recall, at the expense of precision and performance on mild cases, illustrating a sharp trade-off between overall reliability and high‑risk sensitivity. Feature importance, permutation importance, PCA projections, and SHAP analyses show that severity classes are only weakly separable and that a relatively small set of accident, road, and environmental variables drive most of the predictive signal.
The project’s main contributions are: (1) a robust, interpretable baseline model for severity prediction; (2) a systematic assessment of imbalance-handling strategies and their limits under strong class overlap; and (3) SHAP-driven feature pruning and recoding that clarify which conditions are most associated with severe outcomes and provide a foundation for future, more specialized risk models.
Project Context & Objectives
The project uses open government data on bodily injury road accidents in France with focus on mainland for the period 2019–2024. The source provides separate annual CSV files describing accidents, individuals, vehicles, and locations. Rendering 1 established the data context, cleaned and joined the multiple tables, handled missingness and outliers, and defined a consistent feature space for modeling.
The main objective is to predict the severity of injury for individuals involved in road accidents. Severity is defined as a four-class variable:
- Class 1 – Uninjured
- Class 2 – Slightly injured
- Class 3 – Hospitalized (more than 24 hours)
- Class 4 – Fatality (within 30 days of the accident)
The guiding principle throughout the project is that rare severe cases (hospitalizations and fatalities) matter more than overall accuracy, which strongly influences metric choices and modeling decisions.
Problem Classification
The project is framed as a supervised multi-class classification problem. Each sample corresponds to an individual involved in a road accident, and the task is to assign one of four ordered severity levels (uninjured, slightly injured, hospitalized, fatal).
From a business perspective, the model sits in the broader family of risk‑assessment and safety‑analytics problems, similar to fraud detection or medical triage: the critical need is to reliably identify rare high‑severity cases, not just to maximize global accuracy. Several stakeholder groups could derive value from such a model. National ministries (Transport, Interior, Health) and regional authorities could use severity risk scores to prioritize infrastructure investments, adjust speed limits, or target prevention campaigns in high‑risk zones. Traffic safety agencies such as Sécurité Routière or EU road‑safety bodies could integrate the insights into national strategies and monitoring dashboards. Law‑enforcement units could allocate patrols and checkpoints toward conditions where severe outcomes are most likely, while insurers and public‑health services could use predictions to support pricing, triage planning, and resource allocation. Finally, automotive manufacturers and mobility providers could exploit the patterns to refine active safety systems or calibrate autonomous driving algorithms for scenarios with elevated severity risk.
Because of the strong class imbalance and the asymmetric business cost of errors, macro‑averaged F1 was chosen as the main performance metric. Macro F1 treats all classes equally, penalizing models that ignore minority classes even if they achieve good micro‑averaged scores. In addition, the project tracks class‑wise recall, with particular emphasis on classes 3 and 4. Missing a hospitalization or fatality (false negative) is considered much more serious than raising a false alarm for a non‑severe case. Overall accuracy and per‑class precision are monitored as secondary metrics to understand trade‑offs but never drive model selection alone.
Qualitative evaluation complements the quantitative metrics. Confusion matrices are inspected to see which severities are most often confused; PCA plots are used to understand how much the classes overlap in feature space; and SHAP plots provide insight into which conditions increase or decrease the likelihood of each severity level. This combination of metrics and visual diagnostics supports both technical assessment and stakeholder communication.
Project Stages
Data Preparation & Feature Engineering
Following Rendering 1, all accident-related tables for 2019–2024 were loaded, cleaned and merged into a single modeling dataset. The 2018 structural break in the national reporting system motivated the decision to exclude data prior to 2019 to ensure schema consistency and comparability over time.
Key preprocessing elements:
- Data cleaning
- The resulting dataset contains several hundred thousands of records and a few dozen engineered features, each aligned to individual-level severity labels.
- Removal or correction of clearly erroneous values (e.g. speed limits of 700–900 km/h interpreted as factor‑10 entry errors).
- Treatment of non-standard tokens (e.g. “#ERREUR”, “#VALEURMULTI”, non‑breaking spaces).
- Dropping variables with more than ~50% missingness (e.g. some GPS-related or trip-purpose features).
- Filtering and scope decisions
- Overseas territories were excluded from modeling due to small volume and different road contexts.
- The focus is on bodily injury accidents, in line with the source definition.
- Feature engineering and encoding
- Temporal variables (month, hour) encoded with cyclical trigonometric encoding to preserve periodic structure.
- Quantitative variables like speed limit and number of lanes were later also binned to ordinal categories (e.g. speed < 50, 50–90, > 90 km/h) to reduce noise and ease interpretability.
- Categorical variables encoded using One‑Hot Encoding for low/moderate cardinality features and target/impact encoding (CatBoost-style) for very high-cardinality features such as municipalities or postal codes.
- Numerical features scaled with MinMaxScaler and RobustScaler since distributions were non‑Gaussian and many models do not assume standardization.
- In addition, several features were created directly during the aggregation of the relational tables. At the location level, loca_is_intersection and loca_road_counts were derived to capture whether an accident occurred at an intersection and how many distinct roads converge at that point, providing a compact signal about network complexity. At the accident level, an external population-density indicator acc_pop_density was engineered by joining INSEE census data to the accident records as a more informative alternative to the raw acc_department code. This enrichment step illustrates a key aspect: combining internal attributes with external contextual data to better reflect exposure and environmental risk.
The resulting dataset contains several hundred thousands of records and a few dozen engineered features, each aligned to individual-level severity labels.
Model Choice
Several algorithm families were evaluated, each selected for their strengths in handling severe class imbalance:
- RandomForest with resampling (RandomOverSampler/RandomUnderSampler, BorderlineSMOTE, SMOTEEN):
- Provides robust baseline performance through bagging, reducing variance on imbalanced data; resampling integration directly balances minority classes (3–4) during training without custom loss functions
- GradientBoostingClassifier:
- Builds sequential trees to correct errors from prior ones, naturally emphasizing hard-to-classify minority examples in later stages; effective for moderate imbalance via built-in sample weighting.
- XGBClassifier (XGBoost):
- Optimized gradient boosting with regularization to prevent overfitting on rare fatal cases; supports precise scale_pos_weight tuning for class 4 (3%) and early stopping for efficient convergence on large datasets. In practice, XGBoost is also relatively robust to heterogeneous feature scales and moderate multicollinearity, but it is not inherently robust to severe label noise or extreme overfitting if hyperparameters (e.g., depth, learning rate) are poorly chosen, so “robust” only holds under reasonably tuned settings.
- LGBMClassifier (class weights + focal loss variant):
- Histogram-based training scales to high-dimensionality post-one-hot features; class weights boost minority recall, while custom focal loss further down-weights easy majority examples to prioritize severe outcomes.
- CatBoost:
- Was added as an additional gradient‑boosting baseline to explicitly test whether a model with native support for categorical features could outperform our own encoding pipeline. CatBoost’s ordered boosting and internal target encoding are designed to handle high‑cardinality categorical variables and reduce target leakage, which makes it a natural candidate for this dataset with many discrete road, vehicle and location variables. In our experiments, we let CatBoost operate directly on the categorical features (using its internal encoding) and compared the results against tree ensembles trained on our engineered, one‑hot/impact‑encoded feature matrix.
- The resulting scores were essentially identical to those of the other boosted models, with no systematic gain in macro F1 or minority‑class recall. This outcome is still informative: it suggests that our preprocessing and encoding choices were already strong enough that CatBoost’s native handling did not yield additional benefits, and that model performance is robust across quite different encoding strategies. Testing CatBoost therefore served as a sanity check on the feature engineering pipeline rather than as a new state‑of‑the‑art model for this task.
Tree‑based ensembles were preferred because they naturally handle heterogeneous feature types, non‑linear interactions and mixed scales, and integrate well with resampling and weighting for imbalance handling.
SVMs with non-linear kernels were considered but abandoned due to infeasible training times and memory usage at this scale.
Baseline Modeling
As a first modeling step, a baseline benchmark was obtained using a LazyPredict-style sweep of standard classifiers on the preprocessed data, see appendix - table 1: baseline classifier benchmark. Tree-based ensemble models, especially RandomForest, quickly emerged as the best candidates in terms of macro F1 and robustness.
To create a reproducible baseline:
- Data was split into stratified train/test sets on the severity label to preserve class proportions.
- A RandomForest classifier with default parameters was trained.
- To address class imbalance, this baseline already used a combination of RandomUnderSampler + RandomOverSampler on the training set, creating a more balanced class distribution before fitting.
Baseline Performance Summary
The baseline already performed well for uninjured and slightly injured cases, reasonably for hospitalized cases, but was weak on fatalities. This baseline delivered the following results:
- Accuracy around 0.71
- Macro F1 around 0.57
- Class-wise F1 and recall roughly:
- Class 1: F1 ≈ 0.80, Recall ≈ 0.84
- Class 2: F1 ≈ 0.69, Recall ≈ 0.65
- Class 3: F1 ≈ 0.56, Recall ≈ 0.60
- Class 4: F1 ≈ 0.22, Recall ≈ 0.14
The project therefore continued with the explicit aim of exploring how much better class‑4 performance could be pushed without destroying overall utility.
Imbalance Handling
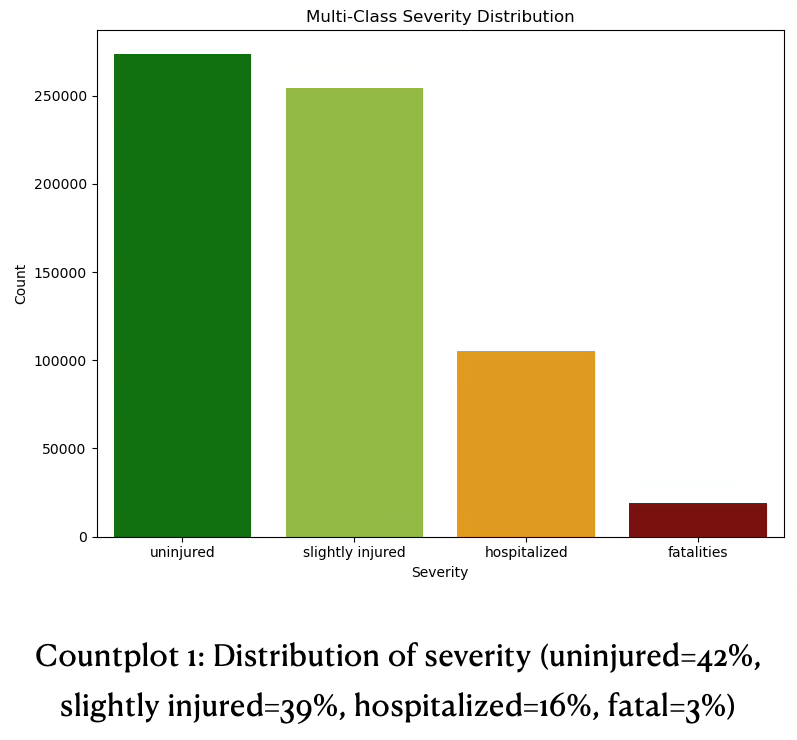
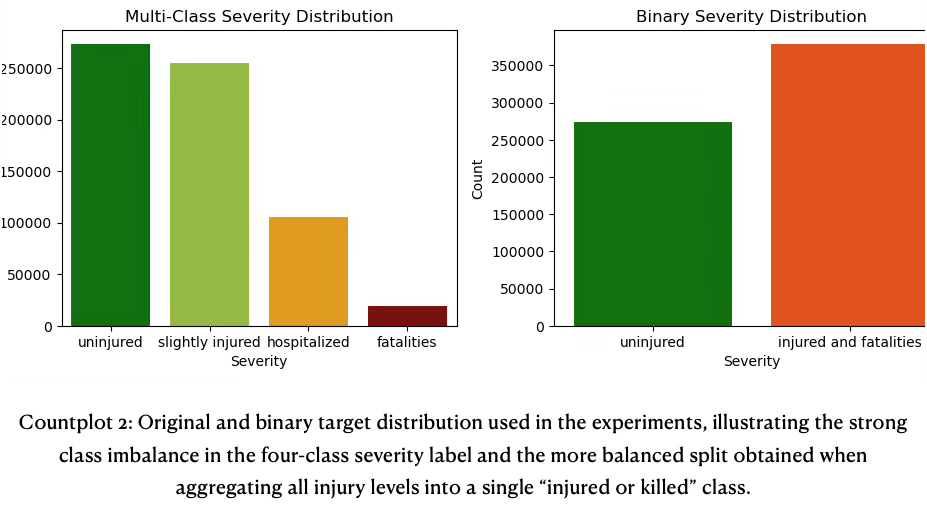
The next stage focused on systematic handling of target imbalance and more aggressive model selection and hyperparameter tuning. Imbalance handling targeted the skewed severity distribution (42% uninjured, 39% slight, 16% hospitalized, 3% fatal) through resampling strategies, class and sample weights and hyperparameter optimization for macro F1 and minority recall.
- Resampling strategies
- RandomOverSampler and RandomUnderSampler (baseline).
- BorderlineSMOTE and SMOTEEN to generate synthetic minority examples near class boundaries and then clean noisy samples.
- Class and sample weighting
- Use of built‑in class_weight options (where available) and custom sample weights based on inverse class frequency, especially for boosting algorithms.
- Hyperparameter optimization
- GridSearchCV and RandomizedSearchCV used with cross‑validation to tune RandomForest and selected gradient-boosted models, optimizing primarily for macro F1 and/or an objective that emphasizes classes 3–4.
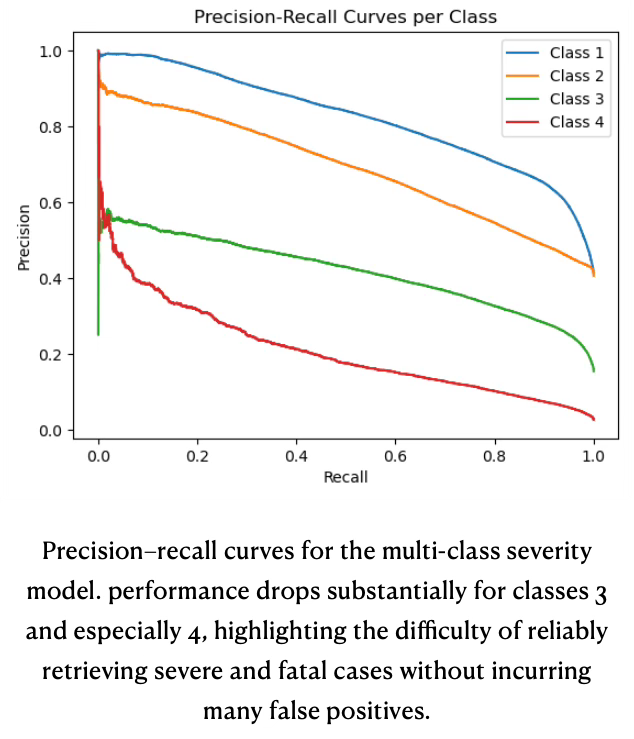
As an additional diagnostic showing how performance degrades as the threshold is relaxed and why class 4 is particularly challenging despite resampling and class-weighting a class-wise precision-recall curve diagram (see diagram Precision-recall curves for multi-class severity) is given for the multi-class severity model. Precision is plotted against recall for each decision threshold, with a separate curve for each severity class (1–4). Class 1 (uninjured) achieves the highest precision across almost the full recall range, class 2 performs slightly worse, class 3 is clearly weaker, and class 4 (fatal) has very low precision once recall moves beyond a narrow region near zero. This visualizes the same pattern seen in the metrics tables: the model handles majority classes reasonably well but pays a large precision price when trying to recover more hospitalized and fatal cases.
Visual Separability & Feature Impact
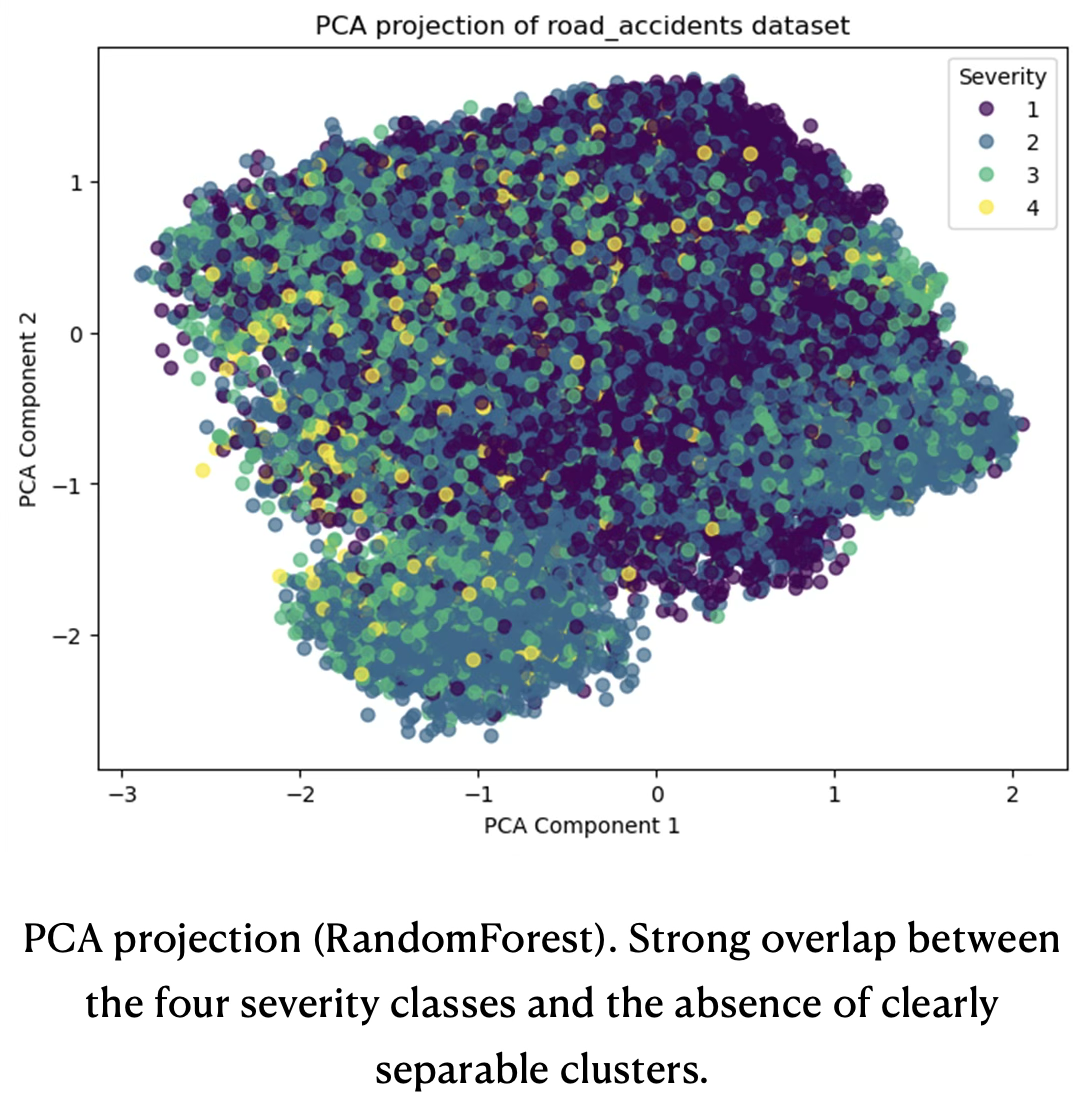
To understand these trade‑offs, a visual separability check was performed. Two complementary projections were generated to assess visual separability under different modeling and encoding choices.
The first PCA plot is based on a 300k‑row stratified sample of the training data used for the RandomForest with combined over‑ and under‑sampling, see below PCA projection (RandomForest) . In this projection, the four severity classes form a single, dense cloud with substantial overlap; points of different classes are interleaved across the entire 2D space, with no clearly isolated regions for hospitalized or fatal cases. This pattern is consistent with the confusion matrices and macro‑F1 results: the feature space does not admit simple linear or low‑dimensional separation between the four severity levels, which constrains the achievable performance of any classifier operating on these inputs.
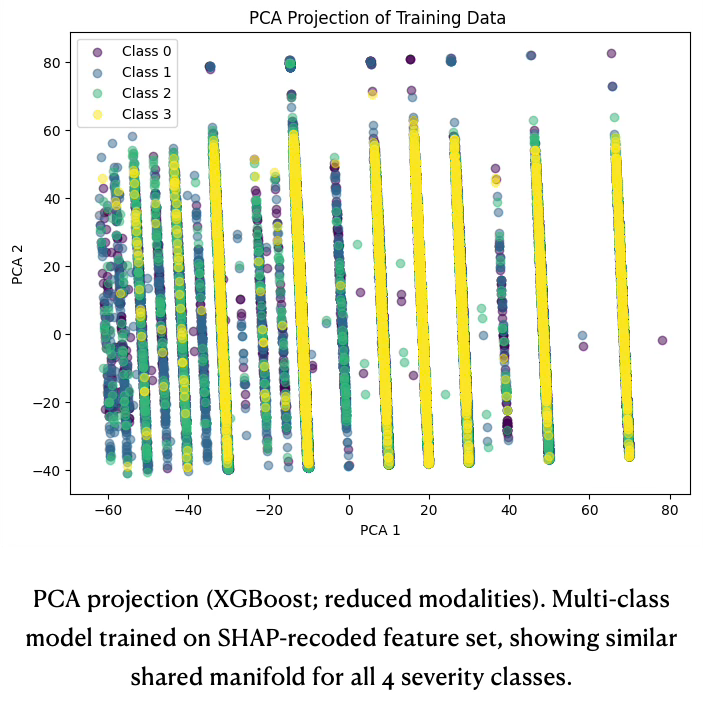
The second PCA plot (PCA projection XGBoost) uses the feature set after SHAP‑driven recoding and shows the representation for one of the stronger boosted models (XGBoost multi‑class, reduced modalities). Despite the more compact and better structured feature space, the projection again reveals heavy class overlap: all four classes populate roughly the same manifold, with only subtle shifts in local class proportions rather than distinct clusters. This confirms that even with improved encoding and a more expressive model, severity remains only weakly separable in a global linear embedding, and that any gains must come from exploiting interactions among features rather than relying on visual separation.
Even when collapsing the target to a binary “uninjured vs. injured/killed” label, the corresponding PCA projection exhibits the same dense mixing of points, with substantial overlap between the two classes and no clearly separable clusters emerging in the first two components.
The PCA projections into 2D show that the severity classes are heavily mixed and do not form distinct clusters, the model cannot separate the classes using simple boundaries in a low-dimensional ‘cluster-like’ way.
Instead, the model has to rely on complex combinations of features (interactions) in the original high-dimensional space to distinguish classes. If the classes formed clean, mostly non-overlapping blobs in the PCA plot, a relatively simple model could separate them; because they are heavily overlapped, only models that exploit many features jointly can do a halfway decent job.
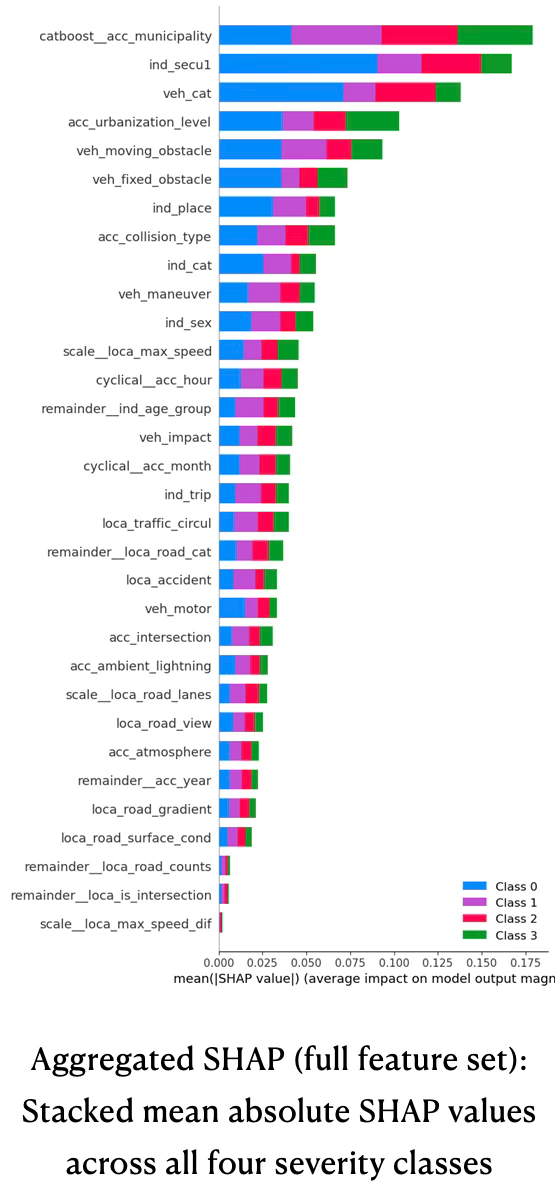
The aggregated SHAP summary across all engineered features confirms that only a relatively small subset of variables drives most of the predictive signal for multi-class severity, see plot aggregated SHAP (full feature set). The top contributors are the CatBoost‑encoded municipality identifier, primary safety equipment (ind_secu1), vehicle category, individual category (driver/passenger/pedestrian), and urbanization level, followed by vehicle and obstacle descriptors and basic demographics such as age group and sex. These features combine structural exposure effects (where and how people travel) with protection and impact characteristics, which is consistent with domain expectations about severity drivers.
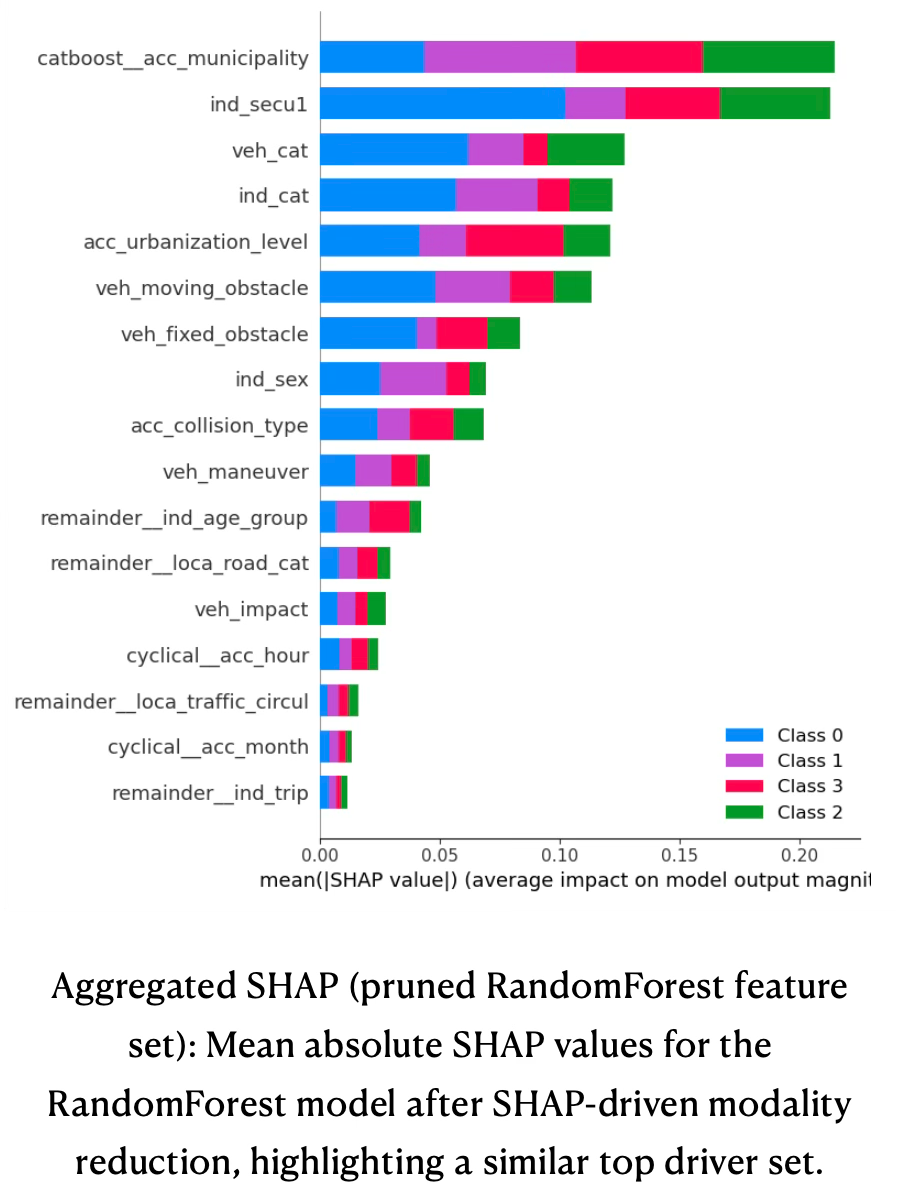
The SHAP bar plot for the pruned RandomForest model shows a very similar ranking, but now concentrated on a more compact set of recoded variables, see bar plot below aggregated SHAP (pruned RandomForest). Municipality, safety equipment, vehicle category, individual category, urbanization, moving and fixed obstacles, sex, collision type, maneuver, and age group remain dominant, while many low-impact road-geometry and atmospheric features drop to the tail. This indicates that the SHAP‑guided modality reduction successfully removed redundant or weakly informative categories without altering which high‑level concepts matter: location, protection, vehicle type, road environment, and behavior still explain most of the model’s output variance, but with a leaner and more interpretable feature space.
Feature Pruning
SHAP values were used to provide class-specific attribution of model predictions to features, enabling targeted recoding of high-cardinality categories. Our goal was to refine the feature space and reduce noise by preserving high-impact modalities while merging low-impact ones into 3–6 semantic groups per variable.
The SHAP analysis confirmed that only a subset of features drives most of the predictive signal for injury severity, with temporal patterns (hour, month), accident descriptors (ambient lighting, intersection and collision types, weather), and individual/vehicle/location attributes (place in vehicle, protection, age group, maneuvers, obstacles, road geometry) showing consistently high impact across classes.
Guided by these SHAP scores, around twenty high‑impact categorical variables were recoded by preserving high‑SHAP modalities and merging medium/low‑impact categories into a small number of semantically coherent groups (typically 3–6 levels per feature), while leaving genuinely strong patterns (e.g. age groups) unchanged. This reduced the total number of categorical modalities to a few dozen grouped levels, substantially shrinking the one‑hot encoded feature space without removing any whole variables. The variables affected by SHAP-pruning are listed in appendix - table 2: Modality reduction.
These changes had three main effects. (1) they reduced the dimensionality of the one‑hot encoded feature space, which improved training time and model stability; (2) they made the resulting model easier to explain to non‑technical stakeholders, since key drivers could be expressed in terms of intuitive grouped categories (for example, “night conditions” instead of five separate lighting flags); (3) they reduced overfitting on rare, noisy categories without materially degrading headline performance metrics.
Using the pruned feature set, the RandomForest baseline with combined over‑ and under‑sampling was retrained and re‑evaluated. Class‑wise metrics remained broadly similar to the original baseline: accuracy stayed around 0.70–0.71 and macro F1 around 0.56–0.58, with small fluctuations at class level.
The main observed gain was greater robustness and consistency across different random seeds and train/test splits, suggesting that the model had become less sensitive to noise in rare categories.
Boosted models were also re‑run on the pruned feature set; while their absolute numbers shifted slightly, the fundamental trade‑off remained unchanged: significantly higher recall for fatalities but at the price of poor precision and weaker performance on the non‑fatal classes. As a result, the pruned‑feature RandomForest remained the preferred “balanced” reference model, while selected boosted variants are kept as alternative “high‑risk emphasis” scenarios for what‑if analyses.
Final Conclusion
After the multi-class experiments it became clear that, although overall accuracy and macro F1 were acceptable, the models systematically struggled on the rare severe classes, especially fatalities. Across the best multi-class configurations, F1-scores for classes 1–3 ranged roughly from 0.55 to 0.80, while class 4 (killed) remained stuck around 0.20–0.27 despite extensive resampling and tuning. This confirmed that with the current feature set and label definition, separating four granular severity levels in a single model was intrinsically difficult, and that the signal for distinguishing fatal outcomes from non-fatal ones was diluted by the intermediate categories.
To better align the modeling task with the main business question—identifying high-risk situations—we therefore reformulated the problem as a binary classification between “uninjured” and “injured or killed”. In this setup, the best tree-based models (RandomForest and XGBoost with tuned hyperparameters) achieved substantially higher performance: macro F1 around 0.79–0.80 with per-class F1 between 0.76 and 0.83, and overall accuracy close to 0.80. In other words, once the three non-zero severity levels were aggregated, the models could reliably detect whether an accident leads to any bodily harm, even if they could not robustly separate slight, hospitalized, and fatal outcomes in a four-way setting.
This binary formulation is not a replacement for the multi-class analysis but a complementary view: the multi-class models provide finer-grained insight into how conditions relate to different severity levels, while the binary models offer a more robust, deployment-ready detector of “any injury vs. none” with clearly improved predictive quality.
To complement this analysis, the target distribution was visualized for both the original four-class label and the derived binary label. The left panel shows the pronounced imbalance in the multi-class setting, with uninjured and slightly injured cases dominating the sample and hospitalized and especially fatal cases forming comparatively small bars. The right panel aggregates the three injury classes into a single “injured or killed” category, resulting in a much more balanced split between “unscathed” and “injured/killed”, which helps explain why the binary models achieve substantially higher and more stable performance than the corresponding four-way classifiers.
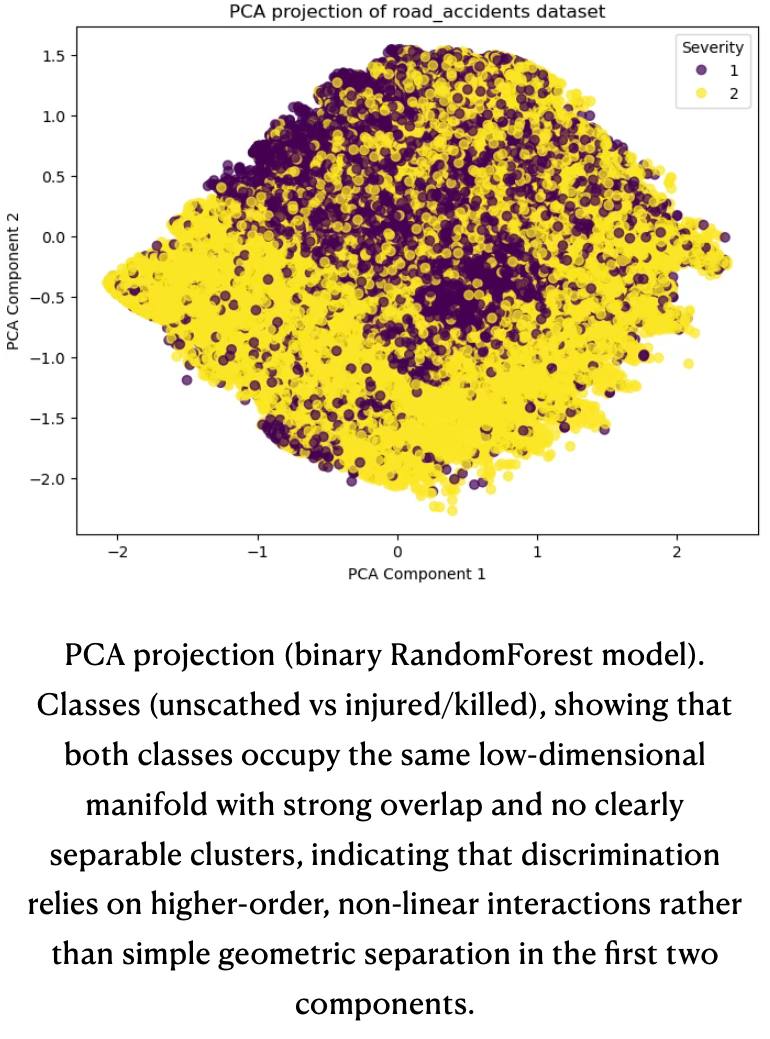
The binary PCA plot shows the first two principal components of the engineered feature space, colored by the collapsed target “unscathed” vs “injured or killed”. The two classes occupy essentially the same 2D manifold; yellow and purple points are heavily interleaved across the projection, with only small local density differences and no large contiguous regions dominated by a single class. This mirrors the multi-class PCA results: even after simplifying the label to a binary outcome, there is still no clear low-dimensional separation between outcomes, so discriminative power must come from higher‑order, non-linear interactions that tree ensembles can exploit rather than from obvious clusters in the leading principal components.
Project Constraints & Practical Challenges
The early stages of the project were dominated by data exploration and scoping decisions rather than modeling. A significant amount of time went into understanding the historical series available on Kaggle (up to 2016) and on the French open data portal, comparing schemas across years, and diagnosing the structural break introduced in 2018. Once it became clear that variable definitions and coding changed substantially at that point, the team decided to restrict the modeling scope to 2019–2024 in order to work with a consistent feature space and avoid mixing incompatible vintages.
Substantial effort was also required to aggregate the four core tables—accidents, vehicles, individuals, and locations—into a single, analysis-ready dataset. Designing stable join keys, handling one‑to‑many relationships (for multi‑vehicle and multi‑person accidents), and enforcing referential integrity between tables all proved more time‑consuming than anticipated, especially when combined with missing or inconsistent identifiers. On the technical side, the team encountered practical limitations around tooling and infrastructure: large raw files were difficult to version on standard Git hosting, which led to experiments with external storage backends; long-running preprocessing and modeling jobs occasionally exceeded local hardware capacity, causing slow feedback cycles and instability. These obstacles delayed some of the planned experimentation, but they also forced the development of more robust data-loading, aggregation, and storage patterns that would benefit any follow‑up work on this dataset.
Future Work & Modeling Outlook
A more systematic analysis of feature behaviour and dependencies would likely reduce noise in the models and improve overall predictive performance. In particular, deeper use of SHAP—via dependency plots, interaction effects, and richer visualizations—could sharpen our understanding of how combinations of conditions drive severity, rather than focusing only on marginal effects. This would move the project closer to reliable predictions for the minority classes, which remain the most challenging aspect of the classification task.
Moreover, a more intense focus on feature engineering, especially around intersection features, could help the models better capture complex interactions between variables. By designing features that explicitly represent these relationships, we would enhance the model’s ability to learn subtle dependencies that are otherwise difficult to detect, thereby improving interpretability and predictive power.
- Advanced Feature Engineering
- Create intersection features to explicitly capture interactions between accident, individual, vehicle, and location variables.
- Explore polynomial and non-linear transformations to highlight hidden dependencies.
- Deeper SHAP Analysis
- Conduct dependency plots and interaction analyses to better understand feature relationships.
- Develop interactive dashboards for exploring SHAP values, enabling more intuitive interpretation.
- Noise Reduction Strategies
- Apply refined imputation methods and conditional encoding to preserve distributional properties.
- Investigate dimensionality reduction techniques to filter irrelevant or redundant signals.
A further opportunity for future development lies in the availability of an official API provided on the French Government’s webpage. By leveraging this interface, a continuous data pipeline could be established, enabling the seamless flow of information from raw data ingestion through preprocessing and into the modeling phase. Such an infrastructure would allow new data to be integrated quickly and efficiently, ensuring that models remain up to date and better aligned with real-world accident patterns.