Road Accidents In France - Part 1: Data Exploration & Preprocessing
Road traffic accidents impose significant human and economic costs, making road safety a critical priority worldwide. Analyzing road accident data requires handling large-scale, complex datasets collected from varied sources.

Series Parts
Context
Road traffic accidents can lead to substantial human and economical costs, therefore road safety is critical concern. The data for this project is sourced from the French government database of annual bodily injury road accidents spanning from 2005 - 2024, providing a comprehensive foundation for analysis. Analyzing road accident data involves managing large-scale, complex datasets gathered with diverse features such as accident severity, geographical location, weather conditions, and temporal details. This domain intersects with data science, particularly in predictive modeling and risk assessment, aiming to identify factors influencing accident severity and locations with higher risk to inform prevention strategies.
This project serves as an applied learning experience to develop and enhance skills in machine learning, data cleaning, and data analysis using real-world datasets. No external consultants or domain experts in road safety and transportation are involved. All analyses and modeling efforts are carried out as part of the skill-building process. Related projects and datasets, including Kaggle collections and prior French government documentation, have been reviewed to guide methodology and benchmarking.
Objective
The primary goal of this project is to develop predictive models to estimate the severity of road accidents in France using historical accident data. The project will undertake systematic data cleaning, feature extraction, and exploration before advancing to modeling and validation phases.
A key objective of this project is to focus the analysis on road accident data from 2019 to 2024, the latest available period. This focus is motivated by a structural change in the data and reporting format that occurred in 2018, which introduced new standards and variables, making earlier datasets less consistent or comparable. Consequently, datasets such as the Kaggle collection that only cover up to 2016 are excluded to ensure data consistency and relevance in modeling and interpretation.
Out Of Scope
Due to time limitations, the development of a risk scoring system for different geographical zones—integrating meteorological data and GPS coordinates to identify high-risk areas—will be considered as a future extension rather than a core objective of this project.
Understanding Data & Data Manipulation
Data Framework
The primary dataset used in this project is the French government's annual bodily injury road accident database, spanning from 2005 to 2024. This dataset is open-access, publicly owned, and downloaded from data.gouv.fr, ensuring transparency and reliability. The data volume is substantial with approximately ~300MB split into 4 CVS files per year. The files contain detailed records of thousands of accidents per year, with each record encompassing multiple features describing accident circumstances, locations, and outcomes. The project focuses on data analysis from 2019 to 2024 due to the mentioned structural changes in data reporting in 2018. The data volume is 190MB for the selected period and describes a total of ~328.000 accidents. On average 54.500 accidents per year are recorded during this period.
Relevance Of Variables
Key variables relevant to the project objectives include the accident severity as the target variable, measured by injury or fatality outcomes. Important features encompass spatial information (municipality, department, GSP), meteorological conditions (weather, daylight), time-related variables (date, hour), vehicle types, and road characteristics (road category, traffic circulation, allowed max speed). These features provide the predictive signals necessary to model accident severity and identify high-risk zones effectively.
Table 1 shows an overview of the target variable and the key explanatory variables identified.
| Variable | Key Variable |
| Accident severity | Target |
| Accident time | Explanatory |
| Atmospheric & lightning conditions | Explanatory |
| Type of collision | Explanatory |
| Spatial info (municipality, address, GPS, department) | Explanatory |
| Involved individuals (gender, driver, passengers, pedestrians) | Explanatory |
| Road info (type, traffic circulation, number of lanes, surface condition, speed limit) | Explanatory |
| Vehicle info (type, collision type) | Explanatory |
Data Limitations
Several limitations affect the dataset's usability. The 2018 change in data structure and reporting means earlier data (pre-2019) may not be fully comparable and is thus excluded from analysis and modeling.
The Kaggle dataset until 2016 had many missing values, especially in GPS 57% of the data is missing.
In the dataset from the French government some features contain missing and erroneous reporting values leading to extreme values and outliers that require careful cleaning and imputation.
Additionally, certain external factors influencing accidents, such as driver behavior or traffic volumes, are not captured within this dataset, potentially limiting model completeness.
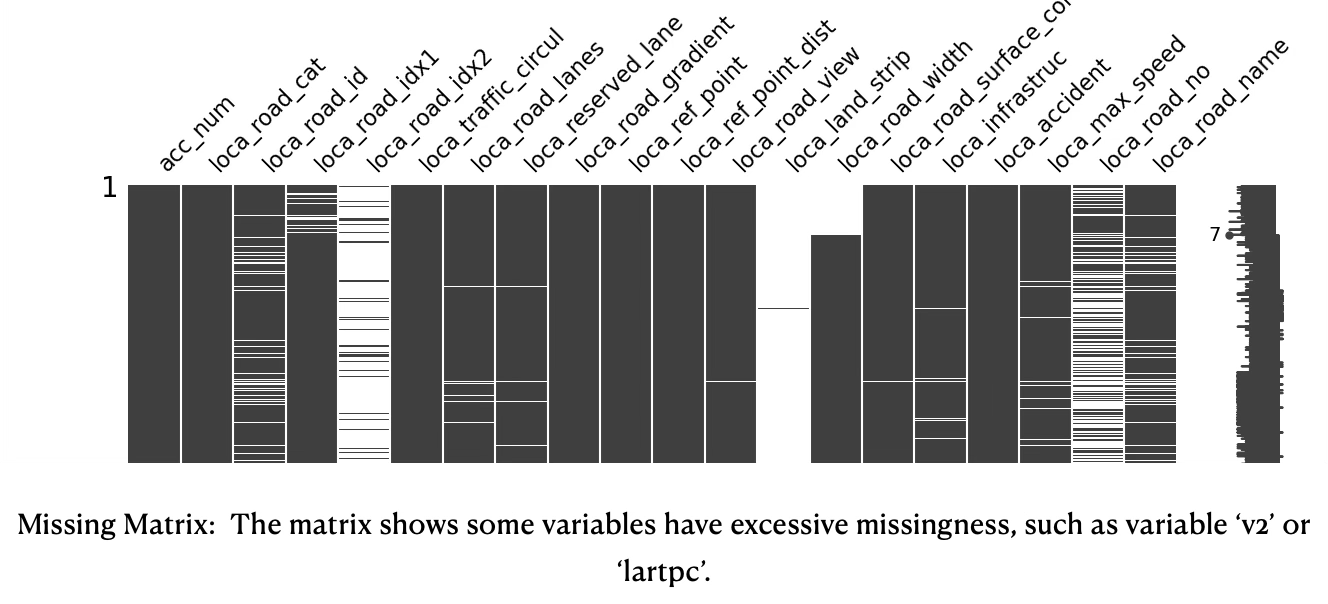
The missing matrix below shows explanatory for the locations variables the missingness. Some variables such as ‘road_idx2’ and ‘land_strip’ show excessive missingness and must be removed in the data pre-processing step.
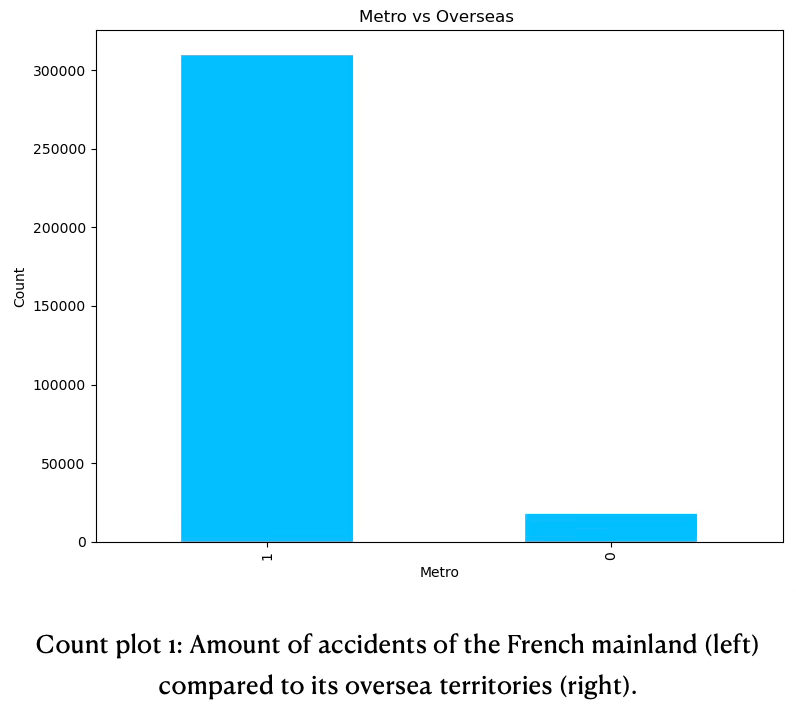
The dataset not only includes accidents of the French mainland, but also its oversea territories. Since the amount of data in the overseas territories is rather small compared to the mainland (see count plot 1 below), it was excluded from further investigation and model training.
Preprocessing & Feature Engineering
Data Cleaning Process
Data cleaning involved addressing missing values, reporting errors and outlier detection to improve data quality, dropping duplicates.
Erroneous values
The number of road lanes had erroneous values, such as ‘#ERREUR’ and ‘#VALEURMULTI’. Strategy was to set those values to NaN (missing value). 630 non-breaking space characters \xa0 had to be handled in different columns and could not be fixed via encoding strategies while loading the data from CSV files.
Missing Values
Missing values appear to be variable-specific and not record-specific. Some variables have significant missingness of more than 90%, such as reason for trip during accident, an alphanumeric index of the road, the size of the land strip running along the center of the road, the number of people in public transportation. Common causes could include structural missingness (variables are not applicable) and data collection & reporting issues (human error, optional items or questions, respondents refuse to answer questions).
Strategy to handle excessive missingness is dropping those variables.
Outlier Treatment
The variable maximum speed had outliers, such as 700, 800, 900. It is reasonable to assume that those extreme outliers are reporting errors.
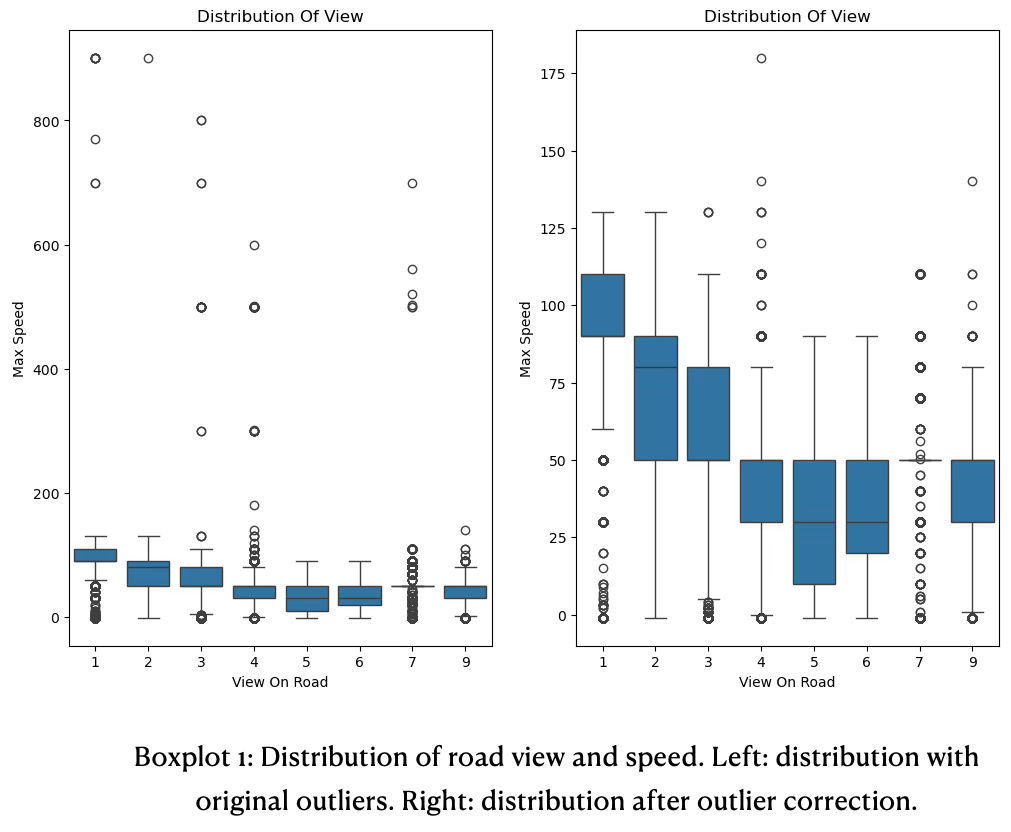
To reduce the amount of outliers an assumption was made of a speed limit of 200. Values above where corrected by factor 10. To identify the cutoff a box plot distribution was used, see boxplot 1.
Visualization & Statistical Analysis
Variable Distributions
Initial visualization of key variables like accident severity, lightning conditions, metrological factors were generated. Pairwise scatterplots and heatmaps highlight relationships and correlations, revealing patterns. Visualizations before preprocessing showed outliers and skewed distributions, guiding cleaning efforts.
Key Quantitative / Numerical Variables
- Location
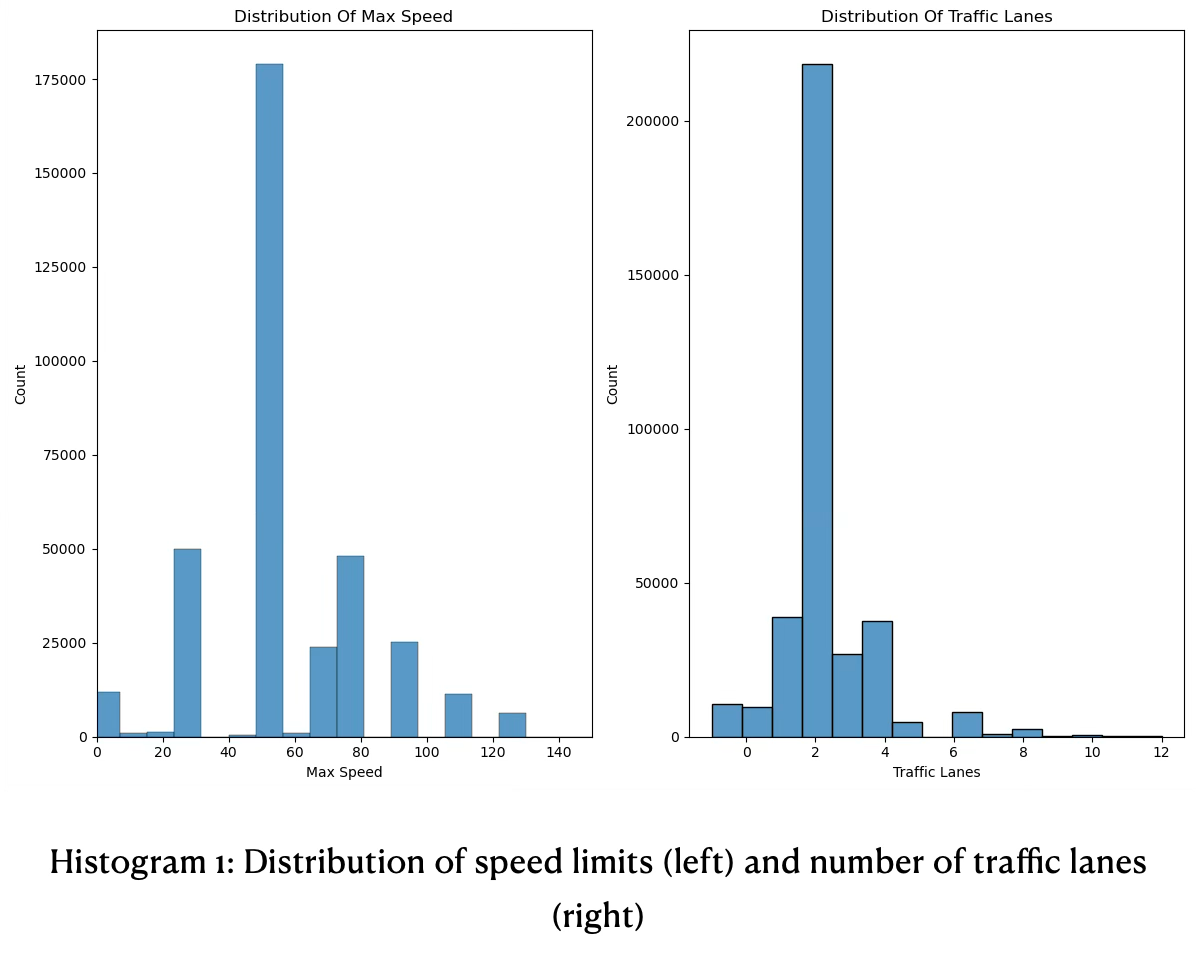
- Most road accidents happen inside zones of speed limit 50, followed by equally often in zones with speed limit 30 and 80. Accidents in zones with speed limit 70 and 90 happen equally often and are on 3rd position. Accidents over 100 happen the least often. Insights are derived from histogram 1 below.
- Accident
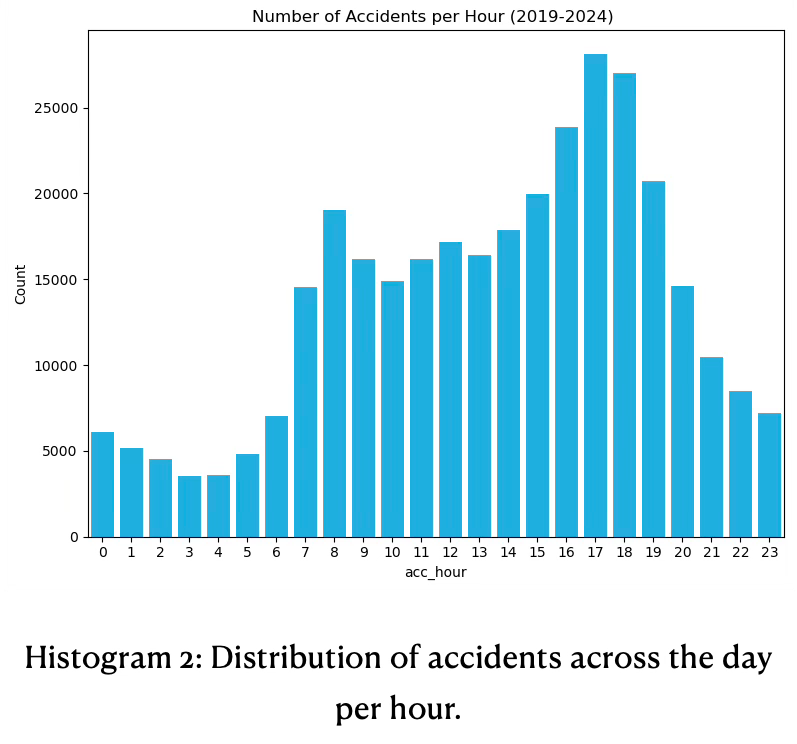
- Majority of accidents happen during rush hours to and from work, specifically during 8h00 in the morning and from 16h00 - 18h00 in the afternoon. From 21h00 the rate of accidents decreases significantly until 4h00 in the morning, before it raises again. The histogram 2 below is used for insights.
Key Qualitative / Categorical Variables
- Location
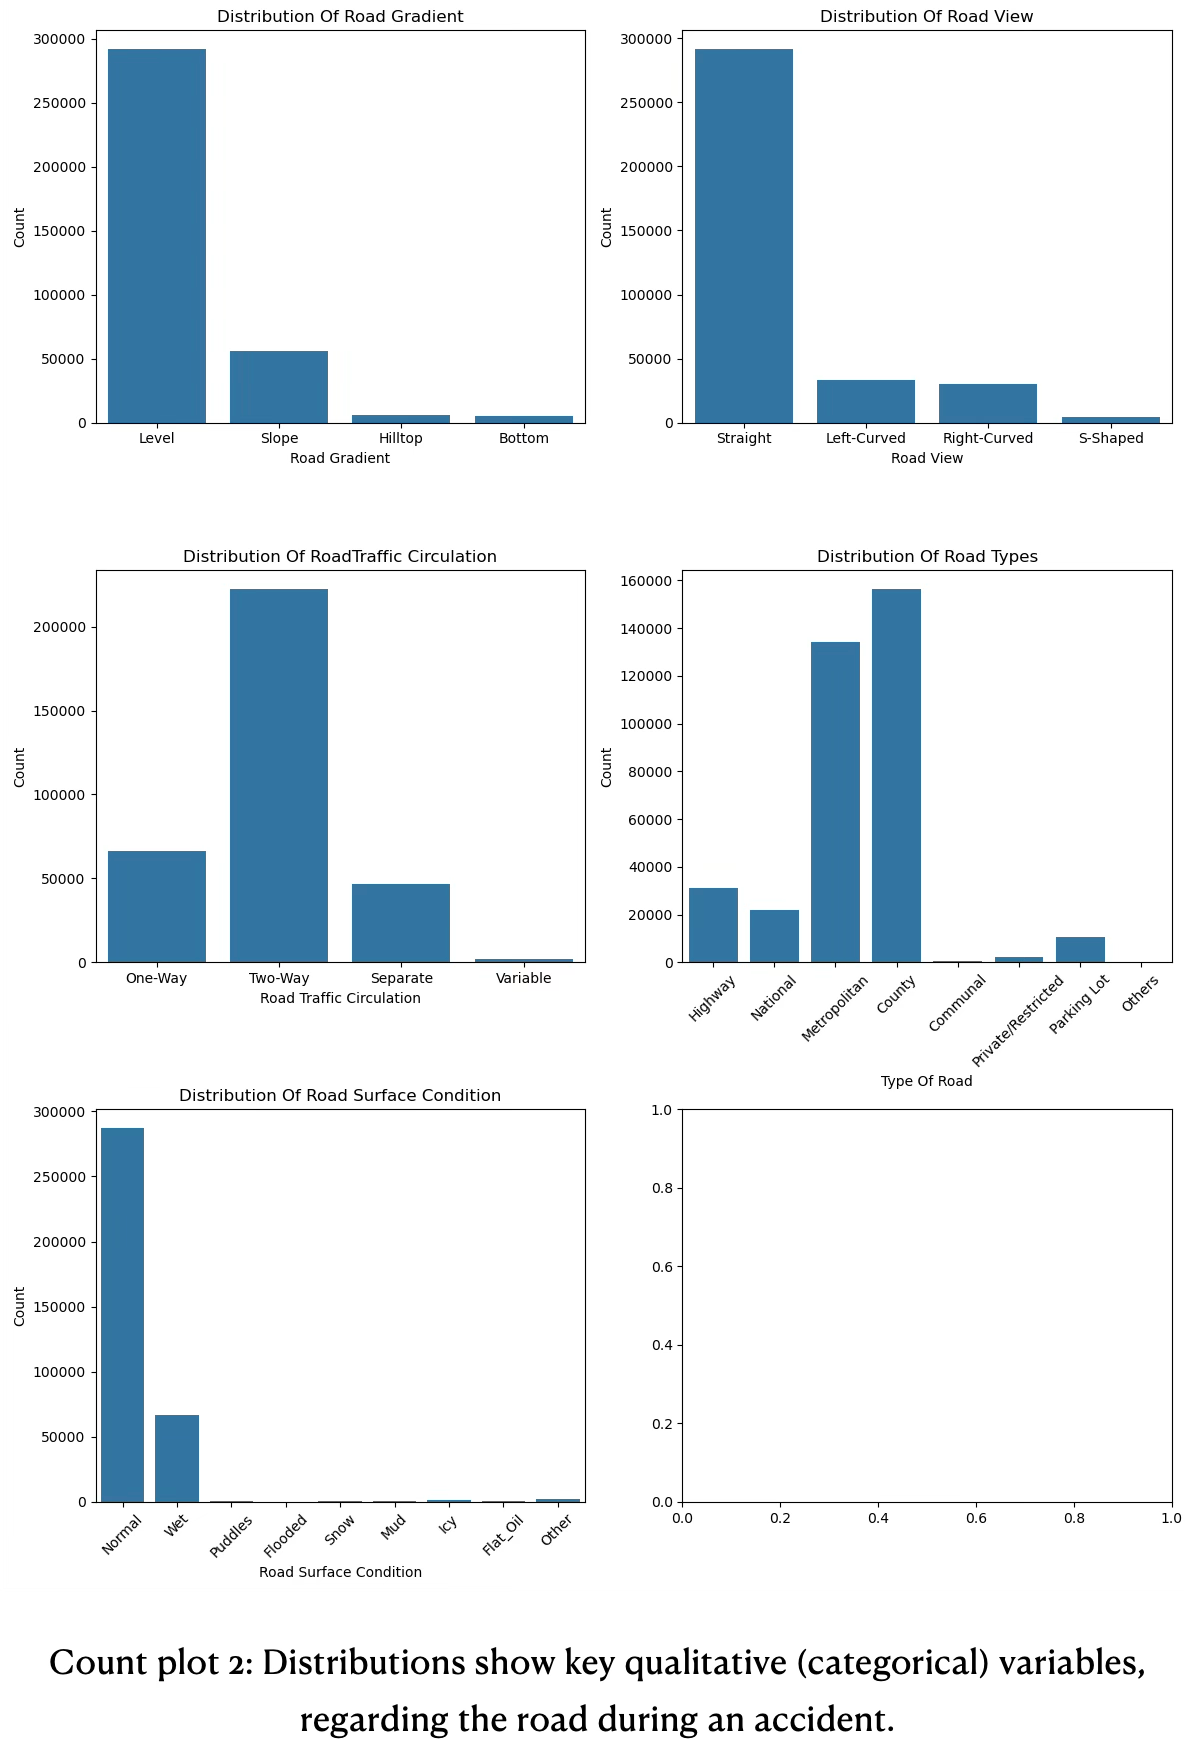
- Most accidents happen on metropolitan and county roads with even straight views on 2-way roads when the road has normal surface condition (dry weather). Significantly less accidents when the road is slope or on a hill top or down at the valley. Also significantly less accidents happen when the road is curved or s-shaped. Accidents on 1-ways or separate lanes happen 4x less often than on 2-way roads. Accidents on highways and national roads where the speed limit is higher has significantly less accidents than metropolitan and county roads with stricter speed limits. These insights are found in count plot 2 below.
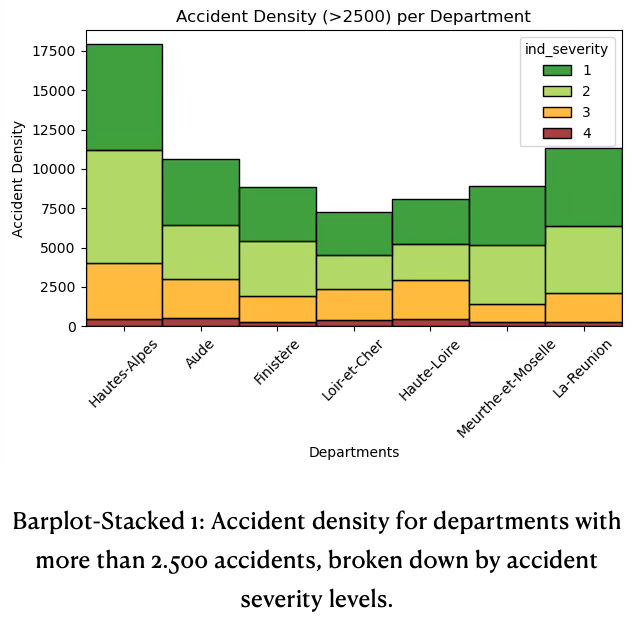
- Most accidents result in minor injuries or none across all departments. Fatal accidents are numerically the lowest but present in every department. Accident density and its severity composition vary among departments, with Hautes-Alpes standing out for both total and severe cases, see stacked barplot 1. La Réunion and Aude also have substantial accident densities, dominated with less severe cases. Departments like Finistère, Loir-et-Cher, Haute-Loire, Meurthe-et-Moselle have lower accident densities overall, but the share of hospitalized and fatal accidents remains relevant and proportional.
- Accident
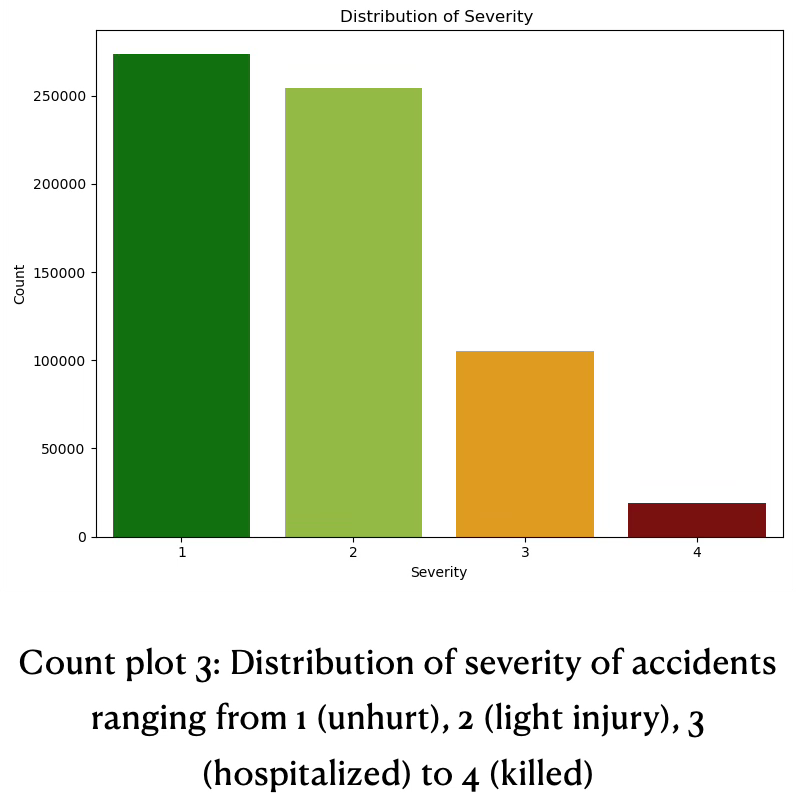
- Majority of accidents results in no injury or light injury. Severe outcomes, such as hospitalization are considerably less common. The pattern suggests most accidents are not severe. A non-negligible number requires hospitalization. These findings can be found in count plot 3.
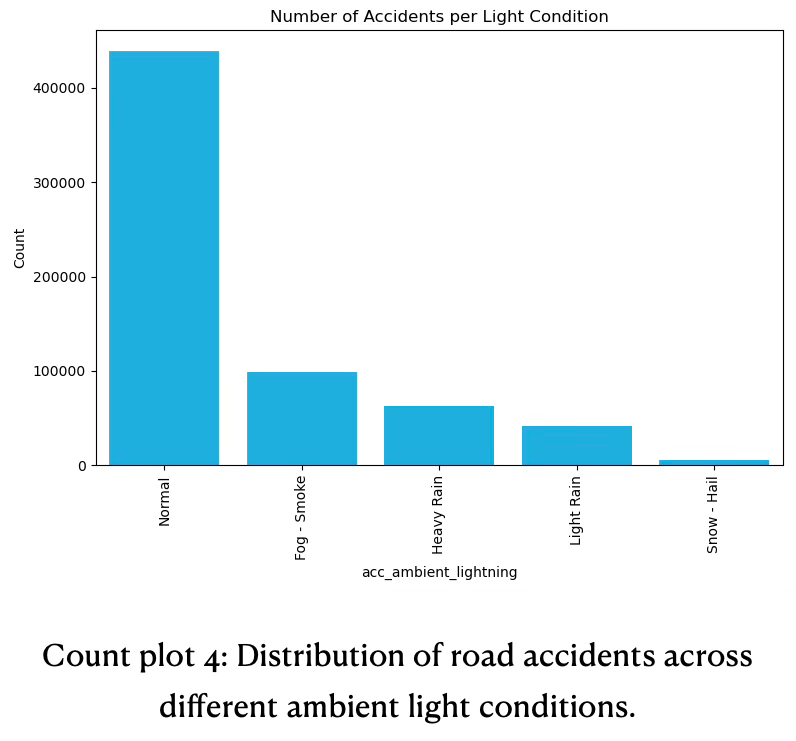
- Light conditions are a critical factor in accident rates and may influence road safety. A significant amount of accidents happen during broad daylight. This reflects most driving — and therefore most exposure during rush hour — occurs during daytime, when traffic volume and visibility is greatest. The substantial drop from daylight to night conditions highlights that fewer accidents occur at night, likely due to reduced traffic volume. See below count plot 4 for information.
- The majority of accidents happens during normal weather conditions, when streets are dry. This findings strongly correlate with road conditions from count plot 2. This suggests that most accidents happen during clear weather, likely because those are times when most driving occurs and roads are busiest.
- Other weather conditions are associated with reduced visibility and slipperier roads, such as rain, overcast, fog. The number of accidents in these categories is significantly lower than in clear weather. Dangerous metrological conditions are rare and account only for small share of total accidents.
- User Severity
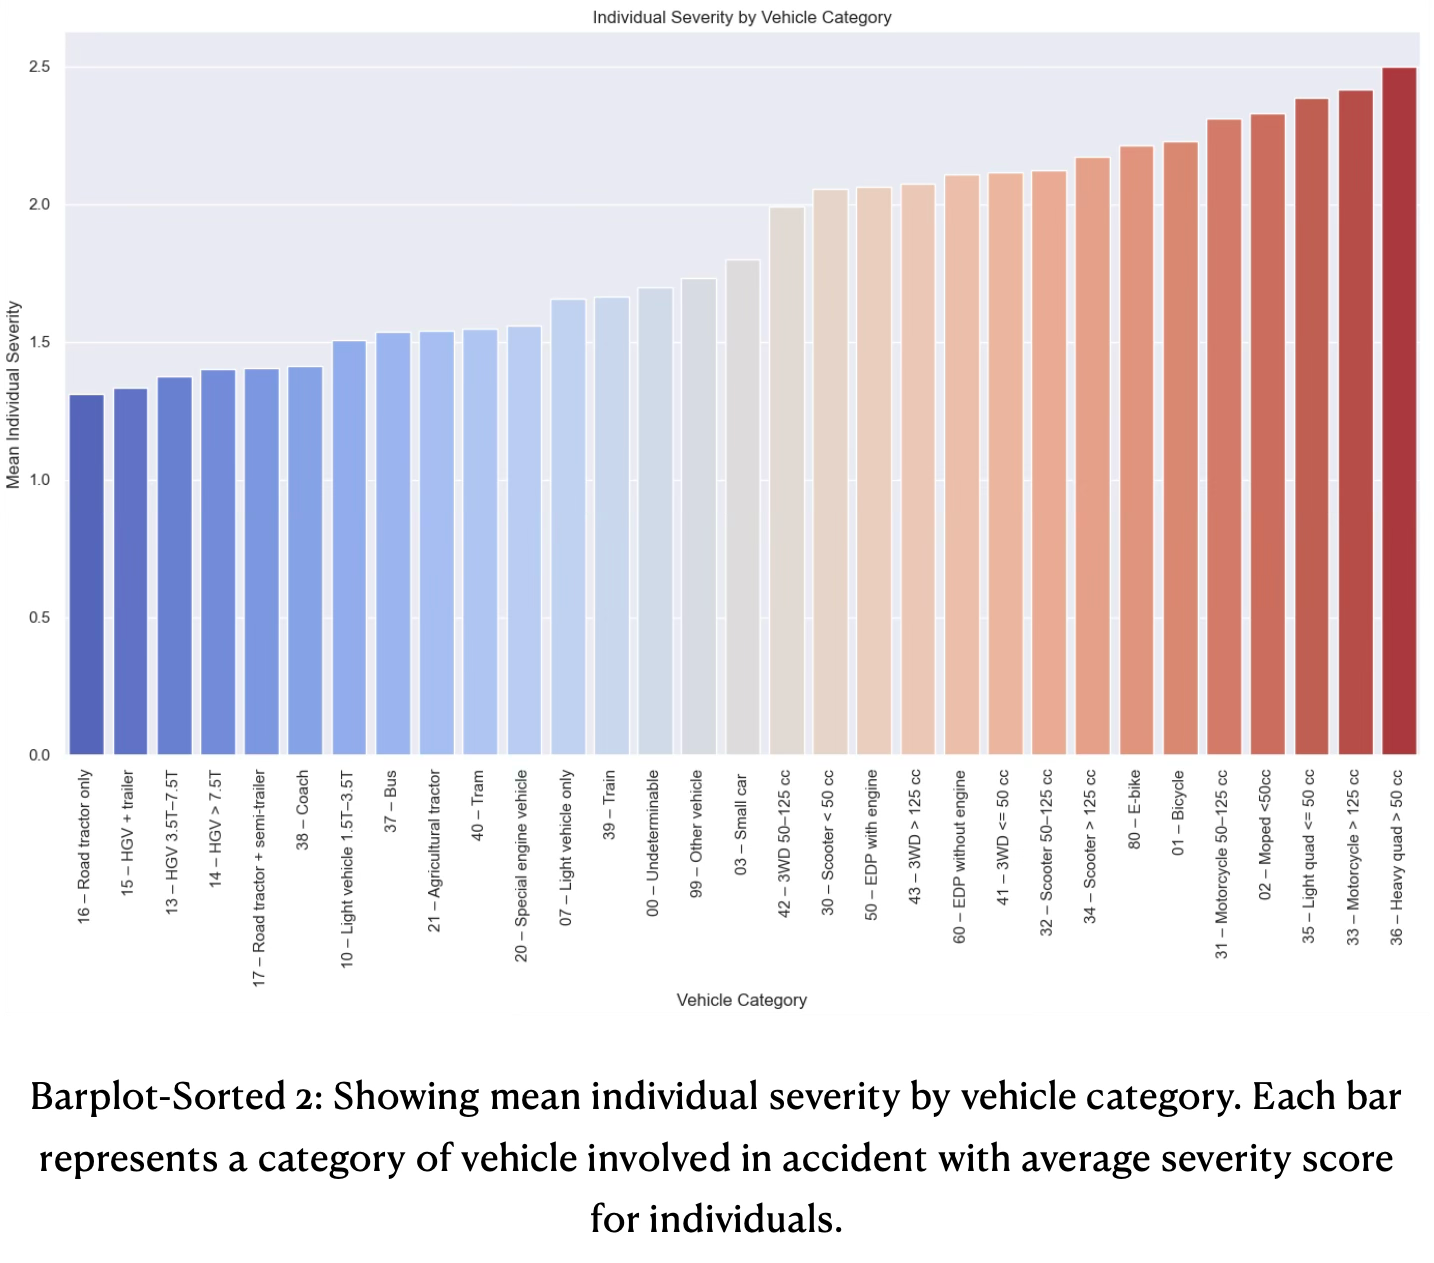
- Average accident severity is much higher for individuals of two-wheeled and light vehicles, than for heavy vehicles, such as buses and tracks, see the sorted barplot 2 below. The analysis provides a clear ranking of vehicle categories by risk.
- Large, heavy vehicles (tractors, HGVs, busses) yield lowest mean individual severity. This suggests that individuals tend to be less severely affected during accidents, likely to greater physical protection.
- Passenger vehicles (cars, trams, trains) occupy middle range of mean severity. Their accident outcomes are more severe than heavy vehicles, but less severe than two-wheeled vehicles.
- The highest mean individual severity is associated with two-wheeled and light vehicles, such as quads, motorcycles, mopeds, bicycles, E-bikes, and scooters. These individuals experience most severe outcomes on average, due to high exposure and lack of protection.
Correlations and Relationships
Locations: Correlation Heatmap
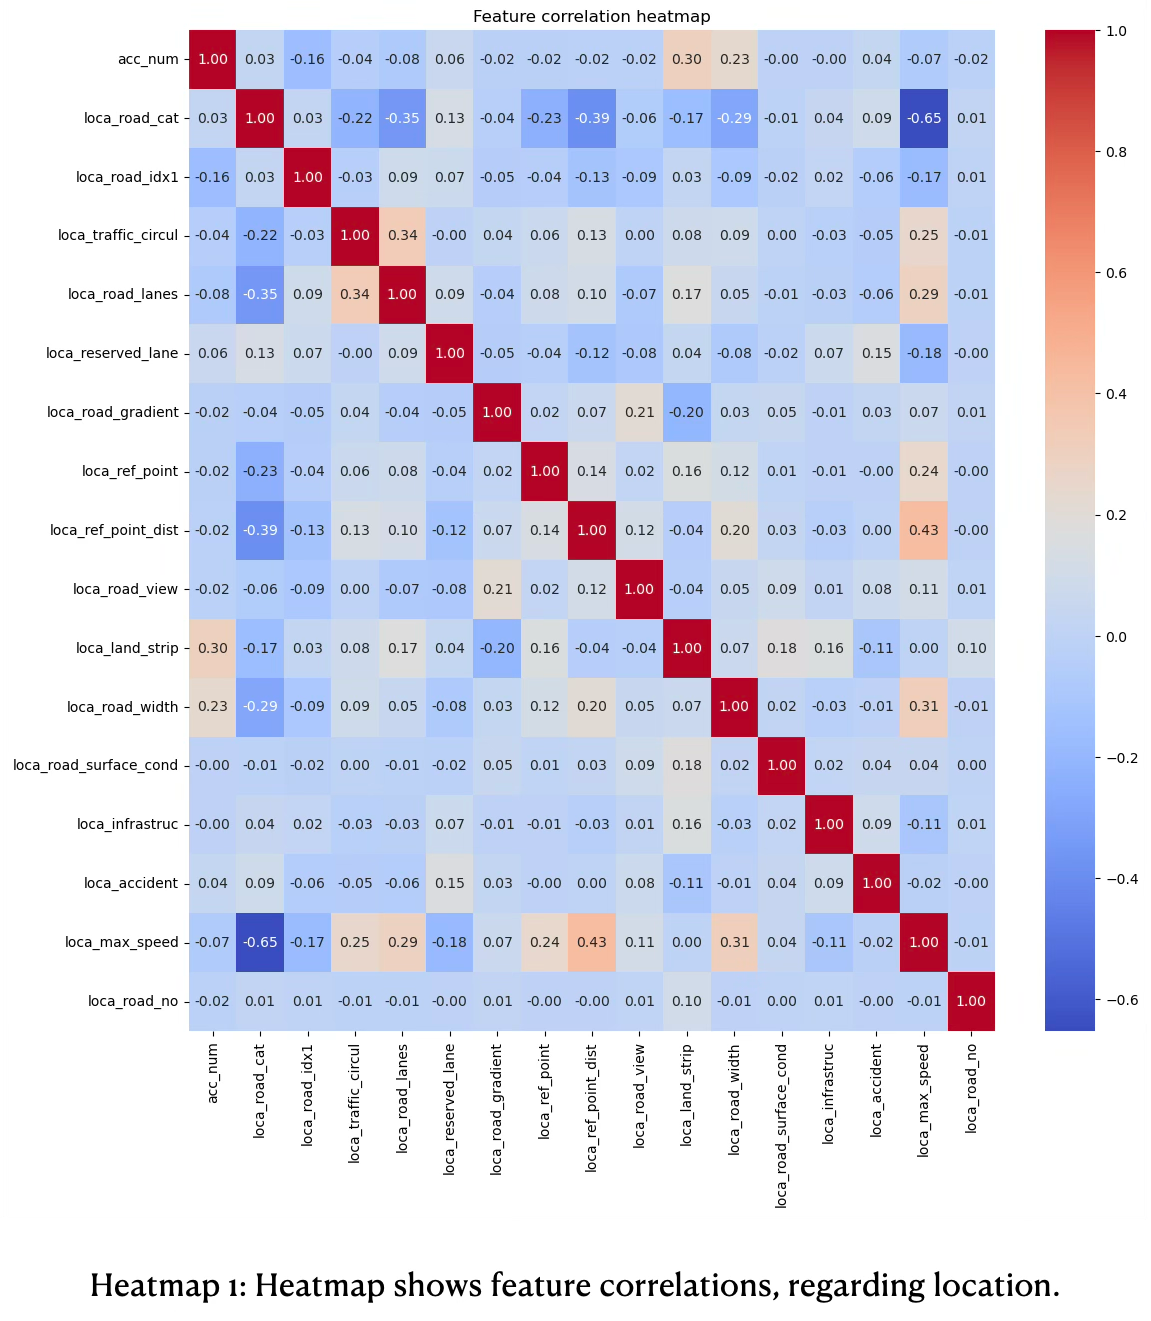
he overall correlation of location features is moderate to weak with correlation of |r| < 0.44, suggesting features have unique information, see heatmap 1. The redundancy between predictors is therefore low.
The road traffic circulation (loca_traffic_circ) has a moderate positive correlation with the amount of lanes of a road (loca_lanes) of 0.34. If traffic circulation increases, then also number of lanes increases.
The maximum allowed speed (loca_max_speed) has a moderate positive correlation with the amount of lanes of a road (loca_lanes) of 0.29 and road width of (0.31), suggesting the speed limit increases when more road lanes exist and roads are wider.
The road gradient (loca_road_gradient) has moderate positive correlation with the road view (loca_road_view) of 0.21, suggesting gradient impacts the road view on the street.
The type of the road (loca_road_cat) has a solid moderate negative correlation with the speed limit (loca_max_speed) of a road segment of -0.65, suggesting that the road type influences how fast someone was before the accident happened. Speed limits are typically set lower on metropolitan and county roads compared to other road types. This findings supports the previous observations found in heatmap 1.
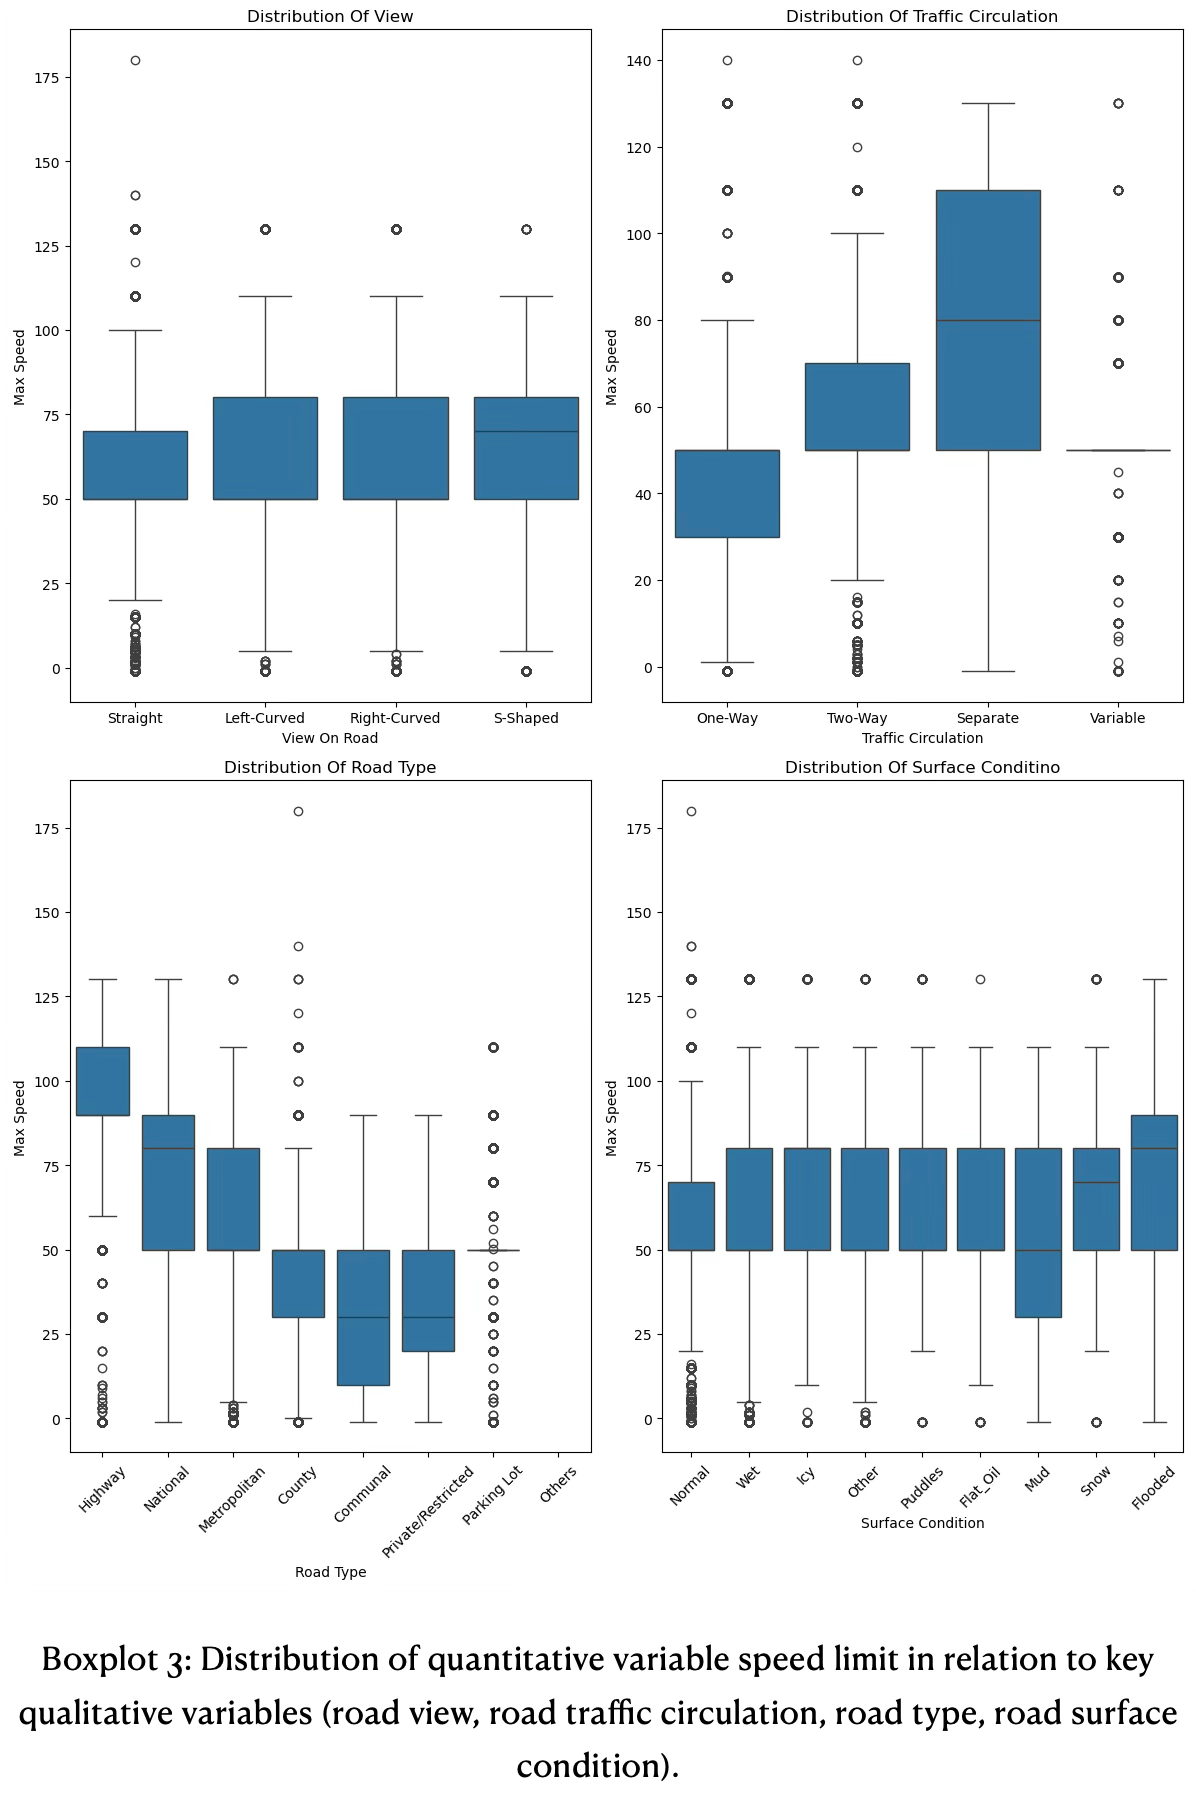
Location: Boxplots
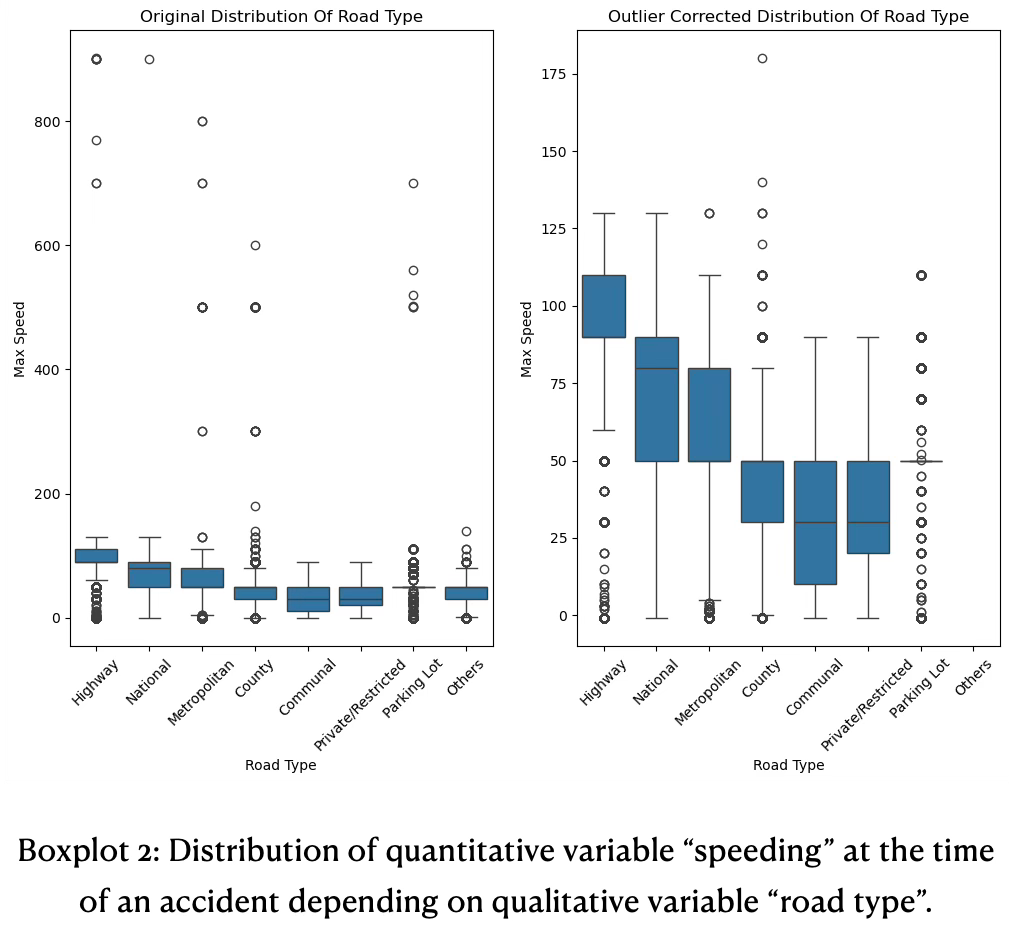
The unprocessed data has significant outliers in the above extreme range, see boxplot 2. Those outliers are reporting issues, for example a speed of 700 is not possible an was likely a speed of 70. There are many similar outliers, see diagram 7 left side. We corrected those outliers by cutting off above 200 and reduced it by a factor of 10. In diagram 7 on the right a cleaner distribution is now emerging. Highways have a tight spread of speed and the IQR is therefore tight (~90 — 110). A median does not exist. Whiskers are from around 60 to 130. Extreme above values do not exist anymore, but there are still extreme below values.
National and metropolitan roads are pretty similar, except national roads have a slight higher IQR spread. The median on national roads corresponds to the 3rd quartile of metropolitan roads. Communal roads have highest IQR spread with a median of ~40. On those roads many 20 and 30 zones and more 1-way streets exist. Parking lots have no IQR spread, but many outliers in the extremes above and below exist. The extreme above are clearly reporting errors.
The road view shown in boxplot 3 has pretty similar IQR spreads and almost identical maximum whiskers, suggesting the speed is always similar to the road view with minimum of 50 and maximum speed of round 80.
The speed on traffic circulations shows a differentiated picture. One-way roads have a tight spread from around 30 to 50, as those streets are usually quiet tight. Two-way roads have a higher IQR ranging from around 50 to 75.
Separate lanes show the largest IQR spread with a median of 80 and a range from 50 to 110.
On highways the speed ranges from around 90 to 110 with whiskers at 60 and 130.
National roads have the largest IQR spread from 50 to 90 with a median of 80 and whiskers above at 130, which is identical to highways.
Metropolitan roads have a speed limit from 50 to 80. They have identical 1st quartile at 50 to national roads.
County and communal roads have identical 3rd quartile at 50. While county has a tight IQR, communal roads show a larger spread with median at 30.
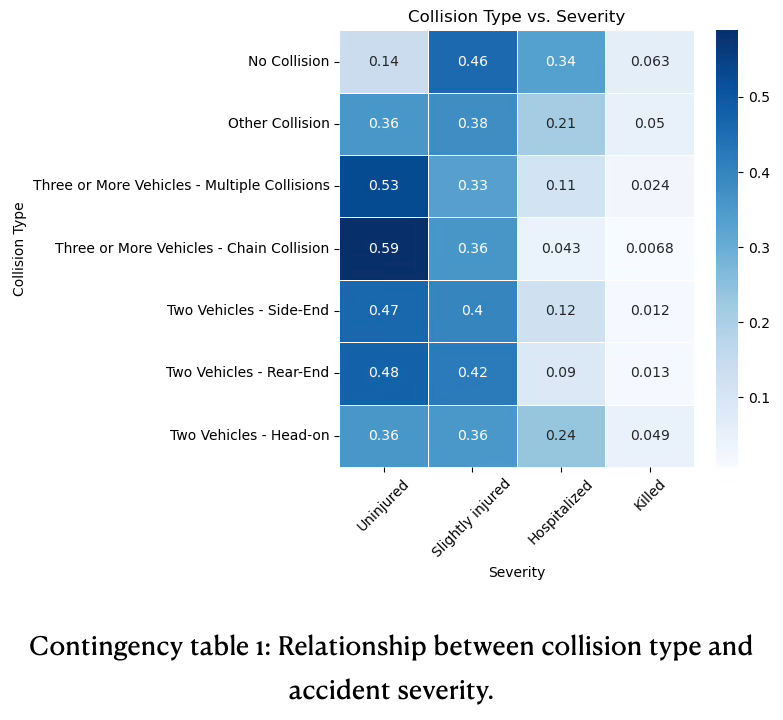
Accidents: Contingency Tables
To visually and quantitatively demonstrate relationships and dependencies between variables contingency tables are used between target variable ‘severity’ and key explanatory features.
The risk of fatal or sever injury is highest for two vehicles colliding head-on and accidents with no collision, for example vehicles leaving the road.
Uninjured outcomes have highest proportions in multi-vehicle collisions (chain 0.59, multi-collision 0.53), suggesting that it often results in less severe outcomes per person involved.
Accidents with no collision have highest proportion for slight injury (0.46). Insights are found in contingency table 1.
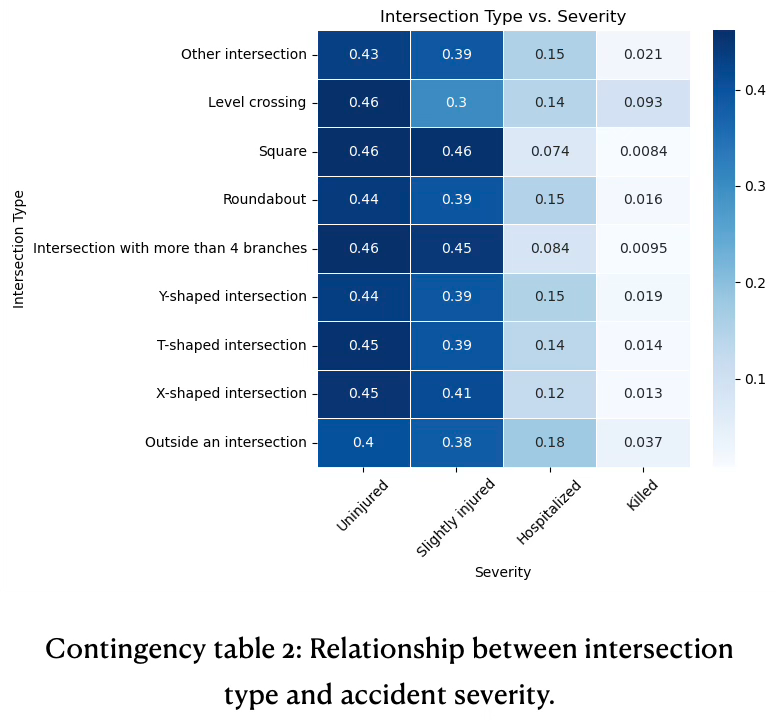
Most intersection-related accidents are minor. Specific locations carry greater risk for severe or fatal outcomes, see contingency table 2.
The proportions of uninjured and slightly injured outcomes are relatively high and consistent across almost all intersections, ranging from 0.38 to 0.46 for uninjured and 0.3 to 0.46 for slightly injured. This suggests that most intersection crashes result in minor or no injuries, regardless of the type of intersection.
The fraction of accidents resulting in hospitalization varies across intersections. Accidents outside of intersection has highest proportion of hospitalization (0.18), while squares and multi-branch intersections have lowest rates.
Fatality rates are highest at ‘level crossing’ (0.093), much higher than any other intersection type.
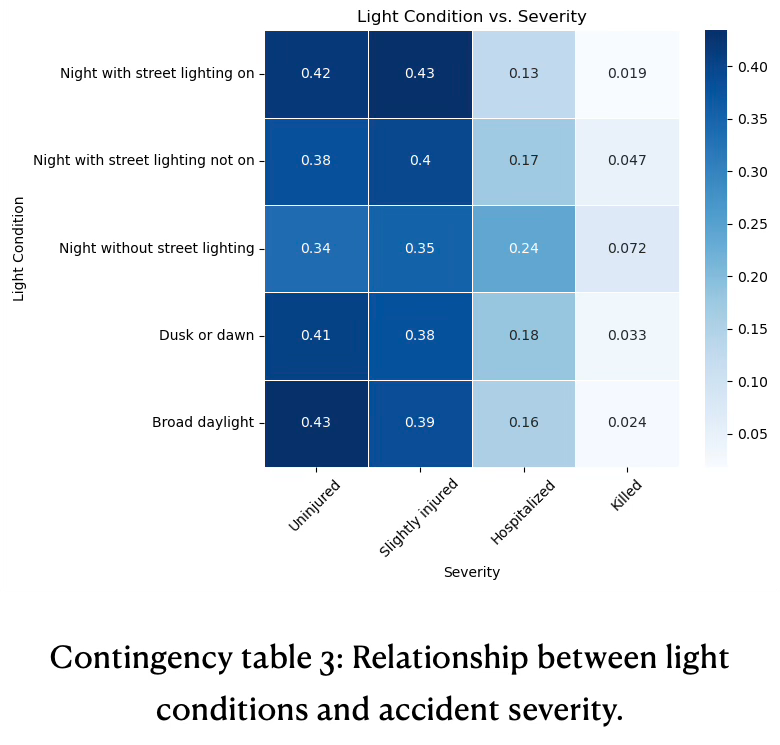
Good lighting conditions are associated with fewer severe and fatal outcomes. Lack of street lighting at night sharply increases the risk of both hospitalization and death, see contingency table 3.
The probability of being hospitalized or killed rises with worsening light conditions. ‘Night without street lighting’ exhibits the highest rates for both hospitalization (0.24) and fatalities (0.07), indicating a clear danger from inadequate lighting at night.
Broad daylight offers best outcomes, with highest proportion of uninjured (0.43) and lowest death rate (0.02) and hospitalization (0.16).
Over the months the occurrence of uninjured, slightly injured, hospitalized, and fatal outcomes is quite stable, see contingency table 4.
The proportions of uninjured and slightly injured outcomes remain consistent throughout all months (~0.4). This indicates that overall severity distribution of accidents does not change with seasons.
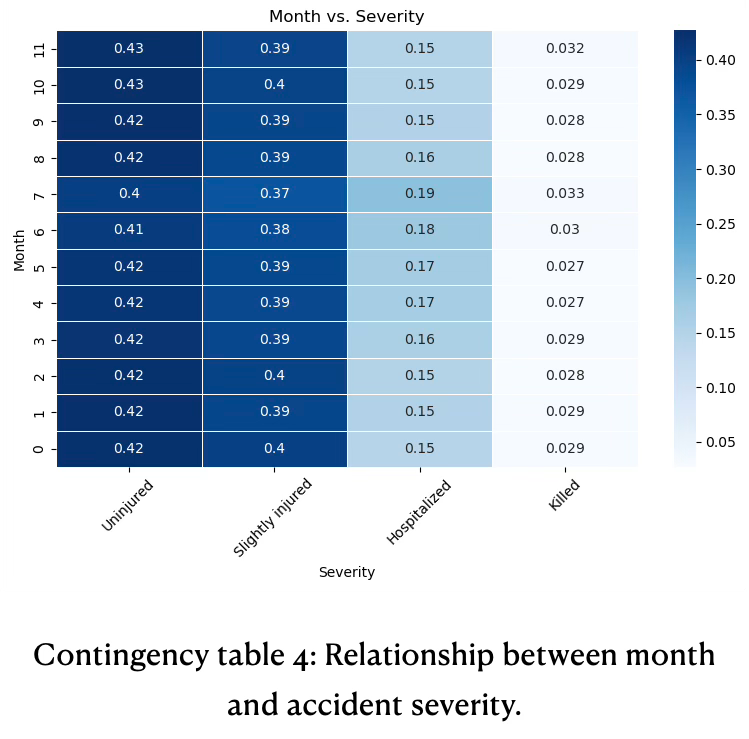
The proportions of accidents resulting in hospitalization is relatively stable, generally around 0.17.
The fatalities proportion is low and fairly steady across the year, with no clear seasonal spike.
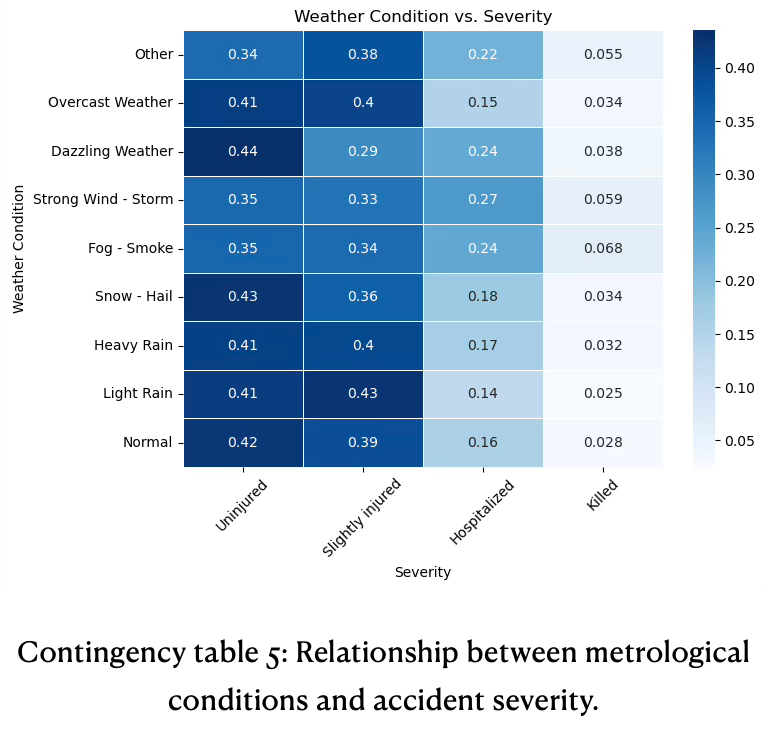
Most accidents, irrespective of weather, result in no injury or minor injuries. Adverse weather conditions (especially fog, storms, dazzling weather) substantially increase the likelihood of hospitalization or death, see for information contingency table 5.
Hospitalizations are higher under fog and storm conditions, for example ‘strong wind - storm’ (0.27). In comparison, hospitalization rates are lower for normal weather conditions (0.16).
Fatality proportions are generally low across all categories, but elevate in fog and storm conditions. Although accidents in these conditions are less frequent, they are more severe when they occur.
Statistical Validation
𝜒2 & Cramer’s V
𝜒2 test was conducted to evaluate the relationship between road type and road traffic circulation. The null hypothesis H0 states, road type is independent of traffic circulation, while alternative hypothesis H1 suggests dependence. The test yielded a p-value of 0.0 which is lower than significance level ⍺=0.05. We reject H0, suggesting statistical significance exists between variables. To assess strength of association, Cramer’s V was calculated and found to be 0.62. Value indicates strong level of association between variables.
To evaluate relationship between road gradient and road view another 𝜒2 test was conducted. The null hypothesis H0 states, road gradient is independent of the road view, while alternative hypothesis H1 suggests dependence. The test yielded a p-value of 0.0, lower than the significance level of ⍺=0.05 and rejected H0. It suggests a statistical significance exists. The Cramer’s V found to be 0.84, a very high value indicating a strong association.
Conclusions and Next Steps
Visual and statistical analyses confirmed that meteorological and lighting conditions affect accident severity, justifying their inclusion as features. Data preprocessing substantially improved data quality and distributional properties, which facilitates more reliable modeling. Findings from data exploration and data analysis directly inform feature selection and modeling strategy in subsequent project stages.
Next steps are splitting the data into training and test sets.