Road Accidents in France - Part 3: Data Deep Dive
Top finding: Severity hard to predict (low fatal recall) due to feature overlap, but SHAP reveals key drivers like safety equipment.

Analyzed 2019-2024 French road accidents data. Models predict injury severity with macro F1 up to 0.80 in binary setup, but fatal cases remain hard to flag.
Series Parts
The Data
Official French government dataset from data.gouv.fr: "Bases de données annuelles des accidents corporels de la circulation routière" (2005-2024), focused on mainland bodily injury accidents 2019-2024 for schema consistency post-2018 changes. Separate annual CSVs for accidents, individuals, vehicles, locations; merged into hundreds of thousands of rows with dozens of features like demographics, road geometry, weather.
Cleaning Hell
Handled multi-table joins with one-to-many relationships, erroneous values (e.g., speed limits 700-900 km/h as factor-10 errors), non-standard tokens (ERREUR, non-breaking spaces), dropped >50% missing vars (some GPS/trip-purpose). Excluded pre-2019 and overseas territories; encoded high-cardinality categoricals (one-hot, target-impact), cyclical temporal feats, binned numerics, scaled with MinMax/RobustScaler. Enriched with INSEE pop density; challenges included large files hard to Git-version, local hardware limits on preprocessing.
Key Insights
- Severity distribution: 42% uninjured, 39% slight, 16% hospitalized, 3% fatal; binary (uninjured vs. injured/killed) more balanced and modelable.
- Top features per SHAP: municipality, safety equipment, vehicle/individual category, urbanization, obstacles, age/sex; PCA shows heavy class overlap, no clear clusters.
- Models: RandomForest (over/under-sampling) best balanced (macro F1 ~0.57 multi-class, 0.80 binary); XGBoost boosts fatal recall but drops precision.
Takeaways
Prioritize safety gear/urban interventions per SHAP; binary models ready for risk dashboards. Policy: Target high-SHAP zones (e.g., poor visibility maneuvers) for patrols/infra. Notebook: [GitHub link]
Improving Road Accident Severity Predictions
Started with baseline RandomForest on raw data, hitting 67% accuracy but weak on fatals (F1 0.10).
Key steps:
- stratified train-test split (70/30)
- preprocessing pipeline (encoding, scaling)
- resampling + hyperparameter tuning to boost macro F1 from 0.49 to 0.57 multi-class (0.80 binary).
Baseline Model
Trained plain RandomForest (200 trees) on processed features post stratified split to preserve class ratios (42% uninjured, 27% fatal). Results: accuracy 67%, macro F1 0.49, fatal recall just 6%—ignores rare severe cases. Confusion matrix shows majority classes dominate predictions.
Resampling for Balance
Combined RandomUnderSampler (downsample classes 1-2 to ~180k each) + RandomOverSampler (upsample 3-4 to 150k/140k). Retrain RF: macro F1 jumps to 0.57, accuracy 71%, fatal F1 0.22 (recall 14%)—better minority capture without leakage (resample train only).
from imblearn.undersampling import RandomUnderSampler
from imblearn.oversampling import RandomOverSampler
from imblearn.pipeline import Pipeline

resampler = Pipeline([
    ('under', RandomUnderSampler(sampling_strategy='majority', random_state=369)),
    ('over', RandomOverSampler(sampling_strategy='minority', random_state=369))
])
X_rs, y_rs = resampler.fit_resample(X_train_processed, y_train)
Hyperparameter Tuning
GridSearchCV on resampled data (3-fold CV), optimizing macro F1 for classes 3-4: params like n_estimators=300-600, max_depth=10-20, class_weight. Best RF: precision/recall/F1 solid for 1-3 (0.56-0.80), holds fatal F1 0.22.
Advanced Boosters
- GradientBoosting (400 trees, sample weights): fatal recall 62% but overall macro F1 drops to 0.50 (precision trade-off).
- XGBoost (scale_pos_weight, encoded labels 0-3): similar, recall 63% fatal, macro F1 0.52.
- LightGBM (class weights/focal loss): boosts fatal recall to 62%, macro F1 0.53; focal aggressively penalizes easy majors.
| Model | Macro F1 | Fatal Recall | Overall Acc |
|---|---|---|---|
| Baseline RF | 0.49 | 0.06 | 0.67 |
| Tuned RF (resampled) | 0.57 | 0.14 | 0.71 |
| XGBoost | 0.52 | 0.63 | 0.63 |
| LightGBM Focal | 0.531 | 0.62 | 0.64 |
Tuned RF wins for balance; boosters for high-risk focus. Next: SHAP pruning!
Exploring SHAP Values to Understand Model Predictions
To enhance the model’s interpretability and performance, we used SHAP (SHapley Additive exPlanations) as a method that quantifies how each feature influences the model’s predictions. By visualizing SHAP values, we can uncover the relationships between input variables and accident severity outcomes, offering both global and local interpretability.
1. Global Feature Importance Analysis
Our first step was to measure global feature importance to identify which variables most strongly impact the model’s prediction of accident severity.
Key findings:
- Municipality emerged as the strongest predictor. This highlights that geography, road infrastructure, and emergency response times significantly affect accident outcomes.
- Safety equipment ranked second in importance, confirming that protective measures - especially seatbelt usage - strongly correlate with avoiding severe injuries.
- Vehicle type also influenced the results; lighter vehicles tended to predict less severe outcomes, suggesting that most car accidents in this category lead to minor or no injuries.
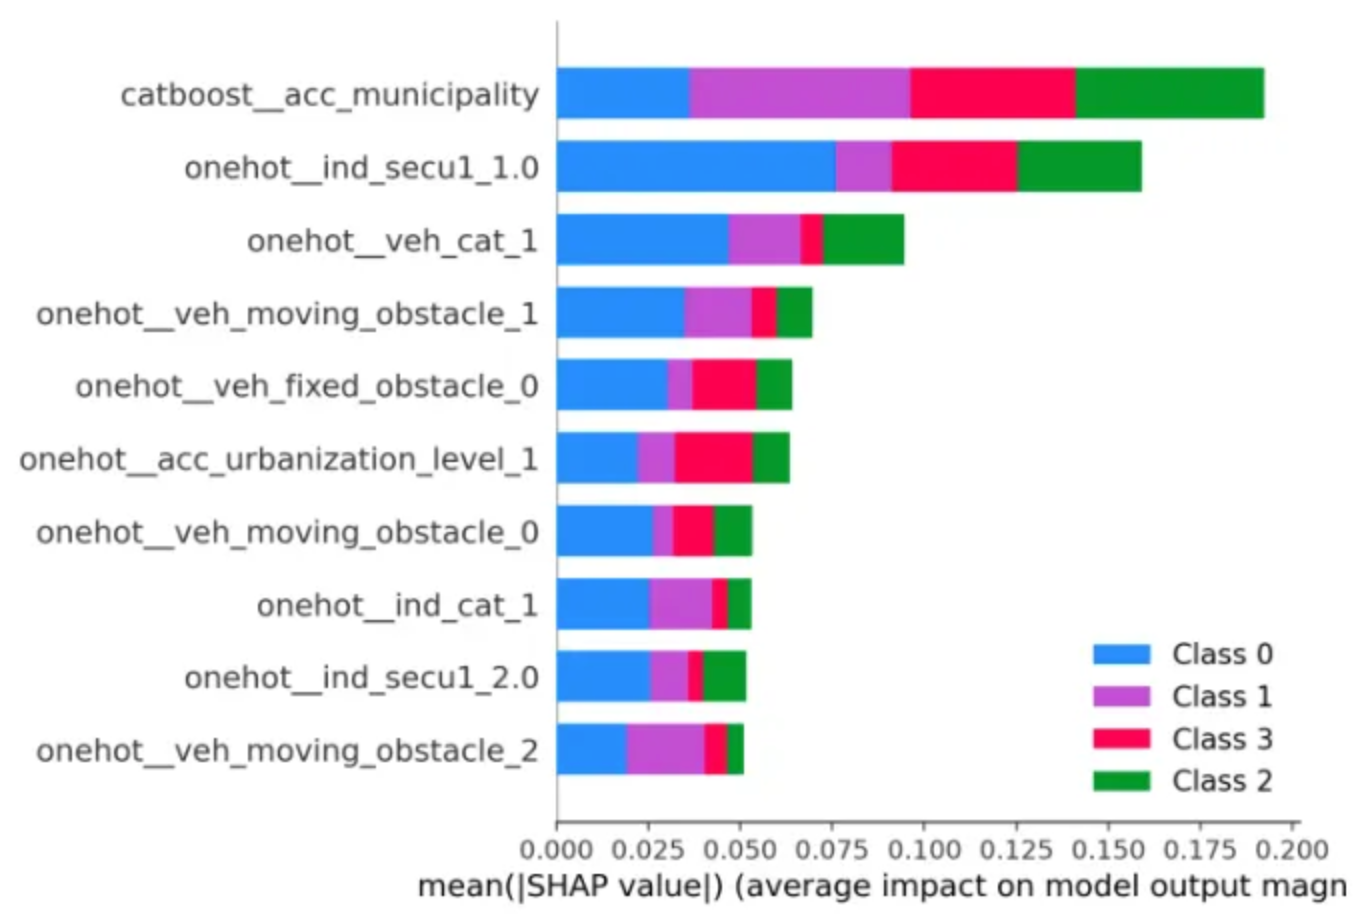
Overall, the global view already revealed that contextual (location) and behavioral (equipment use) factors are pivotal drivers of accident severity.
2. SHAP Beeswarm and Dependence Plots
Beeswarm plots let us visualize how SHAP values vary across all samples and classes. Each point corresponds to one prediction: red indicates a stronger positive SHAP value (pushing towards a given class), and blue indicates a negative influence (pushing away).
We analyzed the “safety equipment” feature across the four severity classes:
- Unharmed (top panel): Using a seatbelt (1) increased the likelihood of predicting “unharmed,” while having no equipment (0) decreased it.
- Slightly injured: The SHAP pattern looked noisy but captured subtle interdependencies. It showed that the effect of safety equipment depends on other features.
- Hospitalized: The influence was neutral to mildly negative, suggesting diminishing protective effects once injuries become more severe.
- Killed (bottom panel): Absence of safety equipment (0) strongly increased the model’s probability of predicting this fatal outcome.
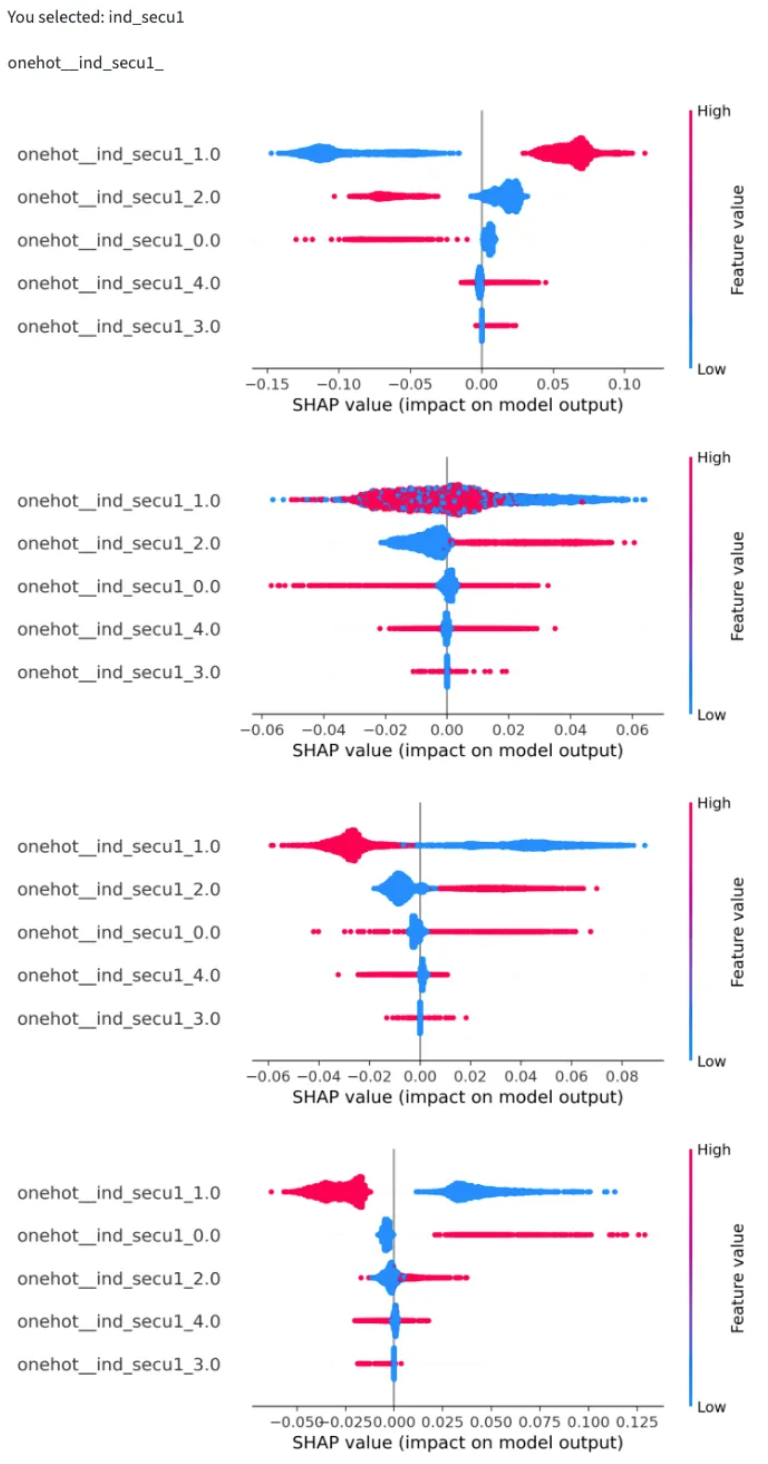
Beeswarm interpretations helped us prune less impactful features and confirm the dominant effect of safety equipment across severity levels.
3. SHAP Force Plot for a Single Prediction
To zoom in on one specific accident, we used a SHAP force plot, which decomposes a single prediction into contributing factors.
- Red segments push the prediction upward (toward more severe outcomes).
- Blue segments push it downward (toward milder outcomes).
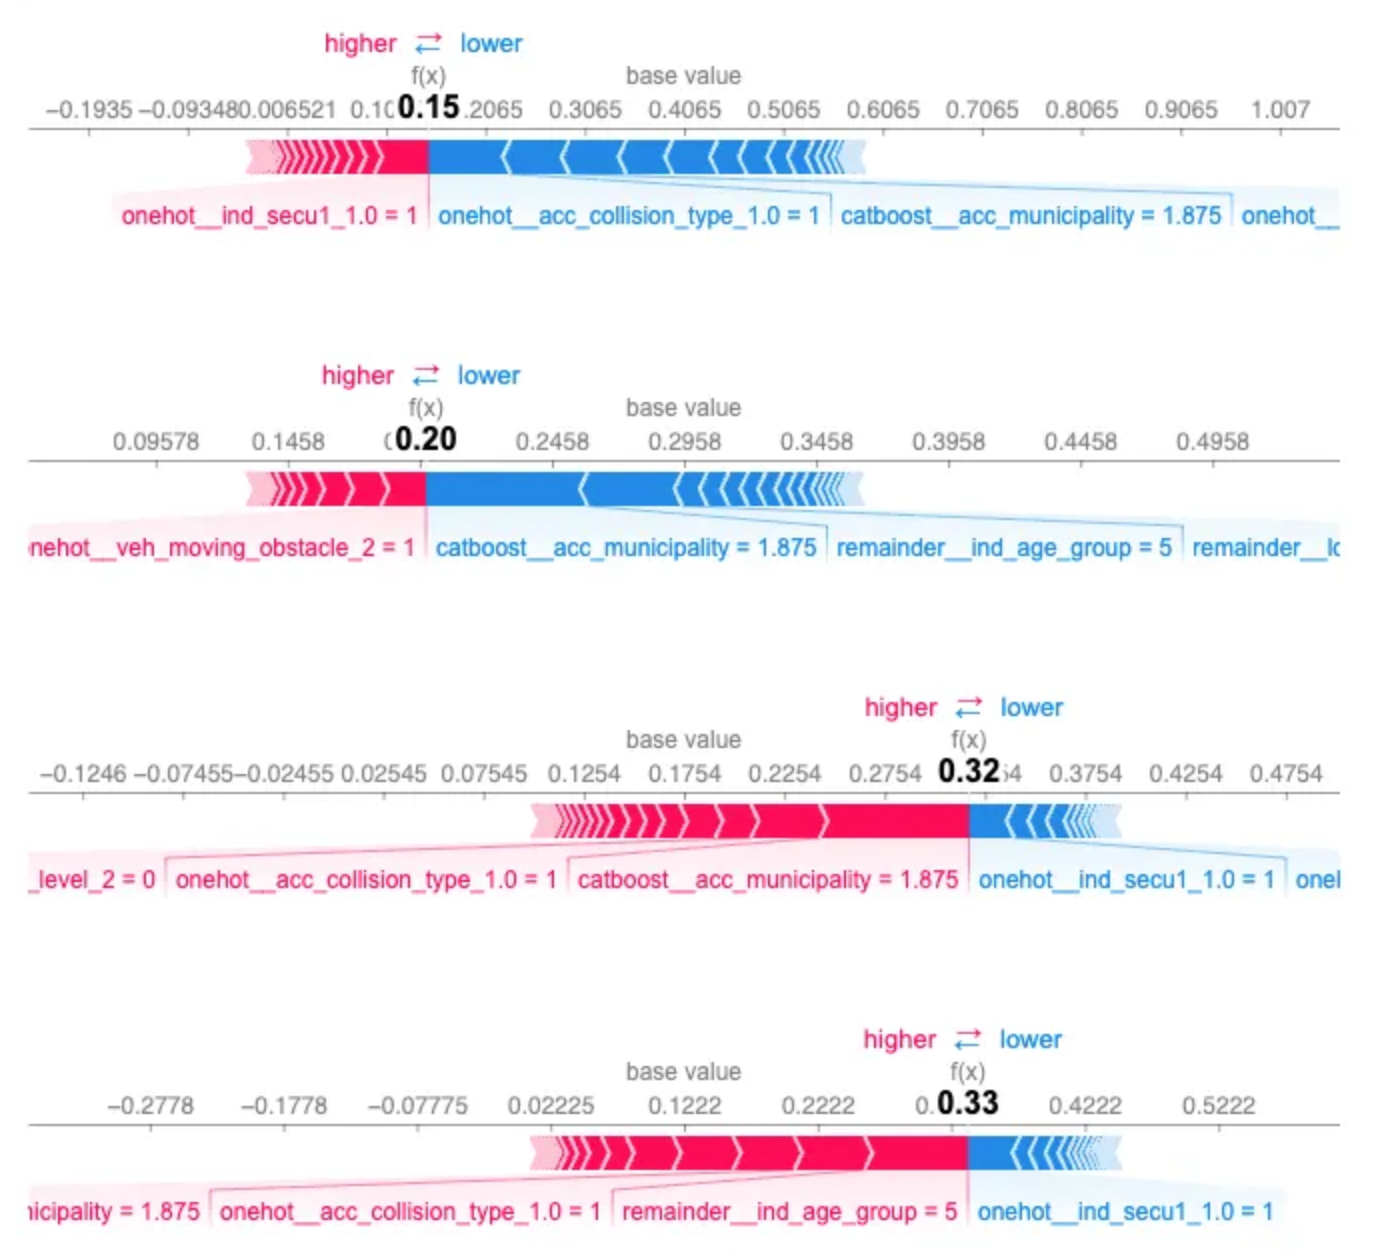
To highlight the difficulties we had with predictions, we use one example and analyze it.
The model predicted almost equal probabilities for “hospitalized” (f(x)=0.32f(x)=0.32) and “killed” (f(x)=0.33f(x)=0.33), showing uncertainty between these two severe classes. Similarly, “unharmed” (f(x)=0.15f(x)=0.15) and “slightly injured” (f(x)=0.20f(x)=0.20) were close.
This ambiguity highlights overlap in feature patterns that lead to severe accidents — a useful pointer for model improvement and further feature engineering.
4. SHAP Aggregation Bar Plot (Global Overview)
Finally, the SHAP aggregation bar plot provided a clear global summary of average feature impacts across all classes.
The longer the bar, the greater the global contribution of that feature.
- Safety equipment had the largest bar, mainly driven by high SHAP values for “hospitalized” (red) and “killed” (green) classes. It is consistent with its role in differentiating severe vs. mild outcomes.
- Municipality contributed strongly to the same classes, capturing local risks linked to infrastructure and emergency response.
- Vehicle type had a notable share for “hospitalized,” suggesting that certain vehicle profiles, such as heavy trucks or motorcycles are more prone to serious injury scenarios.
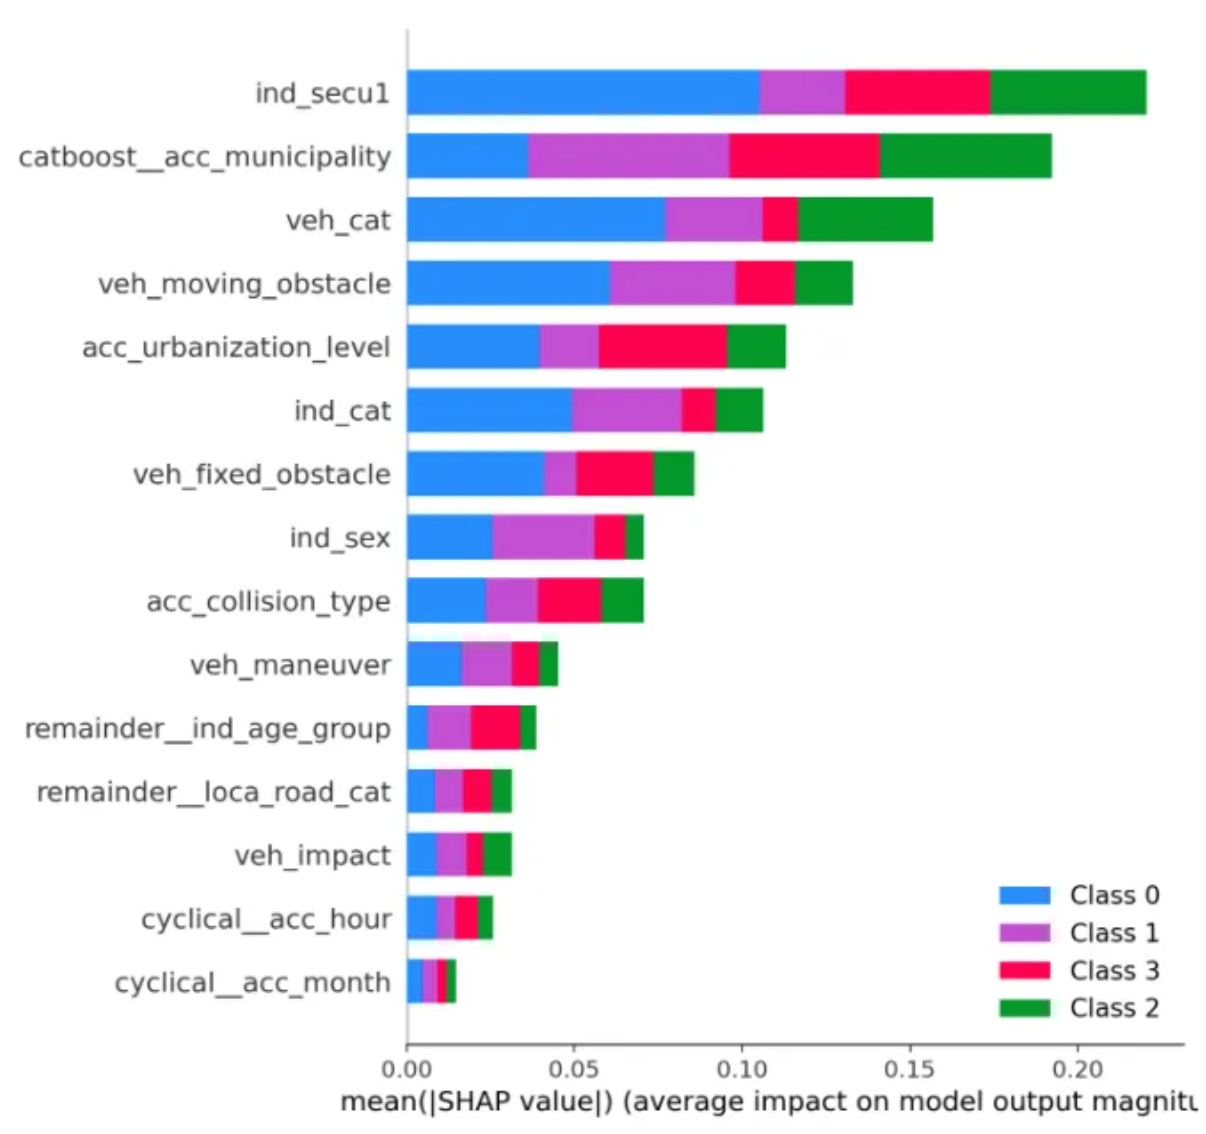
These global insights helped us validate the logical consistency of our model and guided further refinement toward improving predictive performance.
Takeaways: Human and Environmental Factors Shaping Road Safety
The SHAP analysis of the road accident model reveals a clear interplay between human behavior and environmental context in determining accident severity.
- Human factors, particularly safety equipment usage emerge as decisive. Wearing seatbelts dramatically shifts model predictions toward less severe outcomes, emphasizing that preventive behavior has measurable protective effects.
- Environmental and locational factors, captured by the municipality feature, strongly influence severity. Differences in infrastructure quality, traffic conditions, and emergency response times help explain regional disparities in road safety.
- Vehicle-related aspects, such as type and size determine not only the likelihood of involvement in a crash but also the probable injury severity when one occurs.
Together, these insights highlight that accident outcomes are not random but systematically influenced by behavior, infrastructure, and vehicle choice.
Understanding these interactions allows policymakers and safety engineers to prioritize interventions from improving seatbelt enforcement to addressing high-risk municipalities, grounding road safety strategies in data-driven evidence.
Next Steps: From Insights to Action
These SHAP findings open several practical paths forward:
- Model refinement: Targeting municipality and safety equipment interactions for feature engineering, and exploring pruning less impactful variables identified through beeswarm analysis.
- Public policy: Prioritizing seatbelt campaigns and infrastructure upgrades in high-risk municipalities, using the relative importance rankings to allocate resources efficiently.
- Further research: Investigating the municipality vs. vehicle type interactions revealed in force plots to understand regional vehicle risk profiles.
By translating SHAP interpretability into actionable strategies, it bridges the gap between machine learning predictions and real-world road safety improvements.